By the Numbers: WR aDOT
The analytics revolution in sports has not only led to many new statistics used by front offices, but it is also spawned many creative minds to do the same for fantasy owners. A favorite statistic of mine that has gained in popularity is average depth of target (aDOT), courtesy of the great people at Pro Football Focus. For those of you who are unfamiliar, aDOT measures the distance from the line of scrimmage to the point of where a receiver is for every target.
Why use aDOT over YPR?
There is other documentation out there (including from PFF) that shows the predictive advantages of aDOT over YPR, but I thought I would share my own findings to verify what was already concluded. One change I made was to focus it more on the current year’s production by limiting the sample to players that have 75 or more targets in the current year. The previous year’s numbers have no restriction so a player could jump from 12 targets to 88 or 90 targets to 93 and they will both be included. Another change is that I have adjusted both aDOT and YPR to account for quarterback play by normalizing the numbers.
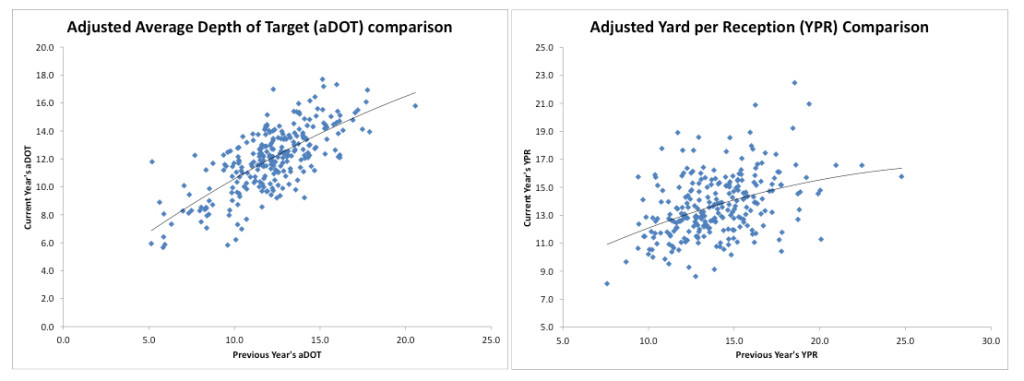
Looking at the charts above, the aDOT comparison has a much tighter fit to the line (0.6 r-squared) while the YPR is less predictive (0.15 r-squared). This means that the variance from year to year with aDOT is much lower and easier to predict than YPR. I can buy this given that a 50 reception receiver can bring up his YPR average by over a full yard with just one 80 yard catch (average annual change in YPR is 1.9). The average change in aDOT for a wide receiver from one year to the next? Just 1.2 yards per target.
How to use this information?
[am4show have=’g1;’ guest_error=’sub_message’ user_error=’sub_message’ ]
Knowing that the adjusted aDOT is more predictive with less variability, we can use this to study some of the outliers and determine if the sudden change is temporary or permanent. Let’s break the players up into two groups: those that went deep in 2014 (saw a sudden gain in target depth) and those that came up short (their depth of target decreased).
Going Deep
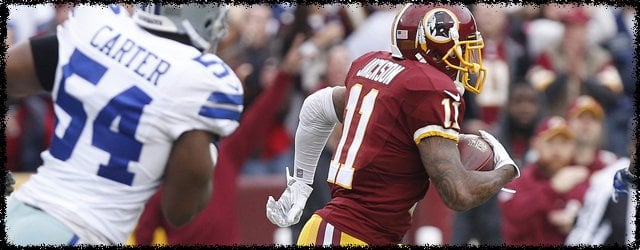
DeSean Jackson (12.3 adjusted aDOT in 2013 to 17.0 in 2014) – Part of this can be linked to a change in team and scheme but Jackson is no stranger to being a deep threat. His three previous year’s adjusted aDOTs were 16.2 (2012), 14.4 (2011), and 15.3 (2010). That makes the 12.3 look like the anomaly here, likely limiting his catch upside but keeping his deep play potential intact. Verdict: Permanent
Cordarrelle Patterson (8.3 to 11.8) – A new offense installed by Norv Turner tried using Patterson further down the field by comparison and it is safe to say that it failed miserably. His catch rate plummeted from 63% to 57% (when adjusted for quarterback play, the gap increases from 65% to 57%) and his percent of targets in the passing game decreased 14% to 12%. Teddy Bridgewater and the coaching staff lost faith here and I foresee them using Patterson closer to the line of scrimmage as a means to get the ball in his hands and let his natural playmaking ability take over. Verdict: Temporary
Mohamed Sanu (9.4 to 12.3) – With A.J. Green sidelined for four games this year and Marvin Jones hitting the injured reserve for 2014, Sanu was asked to step up into the prime receiver role. His depth of target changed little with Green out (12.0 vs. 12.4 in games with Green), but he only managed to catch 58% of his passes. This was a decline from 2013 (64%) but that is expected as your target depth increases. Sanu is not going to see another increase in depth in 2015 but this is sustainable given his size (6’2”) and speed (4.54 40-yard dash) that would suggest some usage down the field. Verdict: Permanent
Greg Jennings (10.3 to 12.8) – Another Vikings receiver who was targeted further down the field, Jennings was aided by Norv Turner’s vertical attack that is utilized to open up the running game. It also reversed a trend of three straight seasons of adjusted aDOT decline (13.3-13.5-13.9-11.4-10.7-10.3) prior to 2014. I see the team using him in a similar fashion to 2014 barring the addition of a field stretching wide receiver. Verdict: Permanent
Brandon Marshall (11.9 to 14.3) – This was a surprising jump in his adjusted depth of target as he has been very consistent prior to 2014. Here are his numbers starting with 2008: 10.8-11.0-11.6-11.6-11.5-11.9-14.3. See the outlier there? He also saw a drop in percentage of targets thrown his way (18%) after six straight years above 25%, which is partially attributed to that increase in depth of target. It is hard to say what the new offense brings to Chicago but I imagine Marshall gets back to his intermediate role. Verdict: Temporary
Brian Quick (14.6 to 16.7) – Perhaps it is a bit of poetry that the surname of this young Rams’ receiver is indicative of his role in the offense. While Chris Givens in 2013 (15.0 adjusted aDOT) and Kenny Britt (17.4) in 2014 were the true deep threats over the last two years, both struggled to catch the ball (44% and 59%). Quick is their only sure-handed receiver who can stretch the field so I see them using him down the field similar to a DeSean Jackson. Verdict: Permanent
Stopping Short
Tavon Austin (8.5 to 3.9) – This was a shocking development as his 2013 depth of target was typical of a smaller receiver who relies on post-catch playmaking (think Percy Harvin). There have been only two other receivers to have 30+ targets and less than a five adjusted aDOT: Dexter McCluster and Julian Edelman. Neither is an apt comparison and both managed the feat just once so it is difficult to believe Austin isn’t targeted at least a little further down the field. Verdict: Temporary
Kenny Stills (17.9 to 13.9) – Stills is a player I will be promoting all offseason as I believe he is the most talented receiver on the team. The decline in adjusted aDOT was accompanied by a leap in catch rate (from 70% in 2013 to 79%) that maintained his elite levels. Even when accounting for the stellar play of Drew Brees, Stills had an adjusted catch rate of 72% which ranked 8th amongst players with at least 75 targets in 2014. As far as his adjusted aDOT, only three players have had two seasons with 17+ adjusted aDOTs since 2008: Calvin Johnson (6’5”), Malcom Floyd (6’5”), and Robert Meachem (6’2”). I don’t see Stills (6’0”) becoming the fourth. Verdict: Permanent
Robert Woods (14.7 to 11.2) – Woods took a huge step in his second season, largely as he moved from being the lead receiver to a supplemental player behind rookie Sammy Watkins. His role in college was a possession receiver (11.6 yards per catch at USC) and his adjusted catch rate (from 52% in 2013 to 65% this year) turned him from a liability to an asset. Even the Bills can figure this one out and maintain his role in the offense. Verdict: Permanent
Keenan Allen (11.6 to 8.6) – Keenan Allen followed up his tremendous rookie season with a slight regression in year two prior to his injury. Part of the blame was the shift in Allen’s depth of target where the team took less downfield chances with him knowing speedster Malcom Floyd was on the other side. Keenan’s adjusted catch rate improved (62% to 65%) so he wasn’t less efficient. At his size (6’2”), he shouldn’t be below Randall Cobb (9.3 adjusted aDOT) and Brandin Cooks, so this should correct. Verdict: Temporary
Justin Hunter (17.7 to 14.7) – Hunter’s 2013 adjusted depth of target was the 15th highest of the last seven seasons. Some regression should have been expected and he does still land in the top 20 (18th) out of 108 qualified 2014 wide receivers. His hands will never improve so why not make him the exclusive deep threat he needs to be to return value alongside possession demon Kendall Wright? While I think his 2013 number is an extreme, I see him rising closer to that level than what we saw in 2014. Verdict: Temporary
Rueben Randle (14.3 to 12.4) – This is an interesting case as my first thought was that Randle had to run shorter routes after Victor Cruz was injured. That wasn’t the case however as his non-adjusted aDOT rose from 13.0 in games with Cruz to 14.3 after the injury. Instead, that role was assumed by Preston Parker (10.0 adjusted aDOT) and the emergence of Odell Beckham (12.1) gave the team two options for downfield throws beyond just Randle. That is evident in the split in deep targets (20+ yard throws) between Beckham (27) and Randle (21). No reason to see this changing and while his aDOT could rise a bit with Cruz hobbled, I think he’ll remain closer to his 2014 aggregate than his 2013 performance. Verdict: Permanent
Thanks for reading and feel free to leave comments about the article or ideas for future pieces.
[/am4show]
- Bowl Game Previews: CFB Playoff Semifinals - December 28, 2018
- The Narrative Fallacy and How it Compels Us - May 13, 2017
- 2017 NFL Draft – College Wide Receiver AIR - April 27, 2017


