The Receiver Rundown: Predicting the 2014 Breakouts

If you haven’t noticed, I’ve been a bit obsessed with pass catchers recently. Yet even given this recent predilection, there’s always more work to be done. As such, I’m happy to present another venture centered around the art of catching the ball in the form of this three-part series which I’ve entitled “The Receiver Rundown.”
In this next-level foray into the NFL’s wide-outs, I hope to examine multiple aspects of receiver production. These studies will go beyond raw statistics, digging deeper into what specifically makes these players fantasy viable. Ultimately I hope to provide a new and unique perspective predicated upon thorough data mining.
Part One of this series focused on what I perceive to be the “myth” of volume dependency. I switched gears in Part Two, narrowing my focus to the scoring ability of the receivers previously chronicled. In this final segment, I will attempt to predict the 2014 breakout receivers, loosely utilizing the data from Part Two and with an assist from a new metric.
At the conclusion of Part Two, I touched upon how the combination of a large AIR value and low touchdown percentage is indicative of a receiver’s raw ability to perform well above the scope of his offense, without a dependence on scoring. Conversely, a smaller (or sub-zero) AIR value coupled with a large touchdown percentage tells a story of a pass catcher far too reliant upon crossing the goal line. These are important quantifiers, as there remains potential for regression at either end of the spectrum.
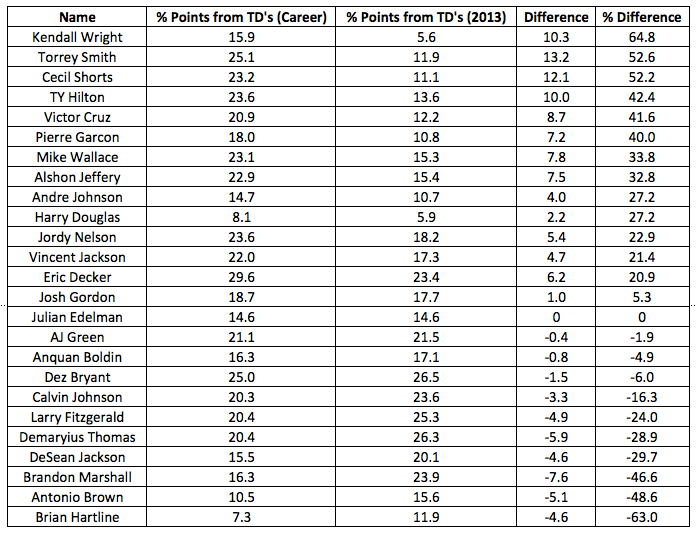
To that last point, each player’s 2013 season represents a singular data point as it relates to the entirety of his career. As such we have a basis for comparison with regards to last year’s touchdown percentages versus prior data. Given that, let’s take a look at these exact differences (sorted in a descending manner – rightmost column) for our recurring cast of characters.
[am4show have=’p2;p3;p4;p5;p6;’ guest_error=’sub_message’ user_error=’sub_message’ ]

In summation, what the above table shows are both the raw and percent differences in touchdown percentages between each receiver’s 2013 numbers and prior data. To obtain the raw difference I simply subtracted the 2013 numbers from the career numbers. To obtain the percent difference as a function of each player’s career numbers, I took that subtractive value, divided it by the prior career value and multiplied by 100.
The reason I’ve chosen once again to focus on touchdown scoring is due to the larger variation of the statistic. Be it due to lack of opportunity, total offensive regression or simply chance, in my opinion it remains the most unpredictable means of accruing fantasy points. However, at the minimum, a semblance of normalcy can be achieved due to these contrasting data points – put more simply, if the numbers regress to their respective means, what can we expect for 2014?
To predict this I sought a way to modify the AIR metric using the percent difference multipliers shown in the rightmost column of the table above. As a reminder, the AIR metric is essentially a series of ratios comprised of malleable values. In its long-form, it can be written as follows:
Filed under the “one of these things is not like the others” category, you might have noticed that the component of a player’s PPR points from touchdowns was highlighted in red. When calculating an AIR value, this element of the equation can be derived simply by taking a player’s total touchdowns and multiplying by six. However, as mentioned above, it behooves us to seek a means of normalizing this particular statistic.
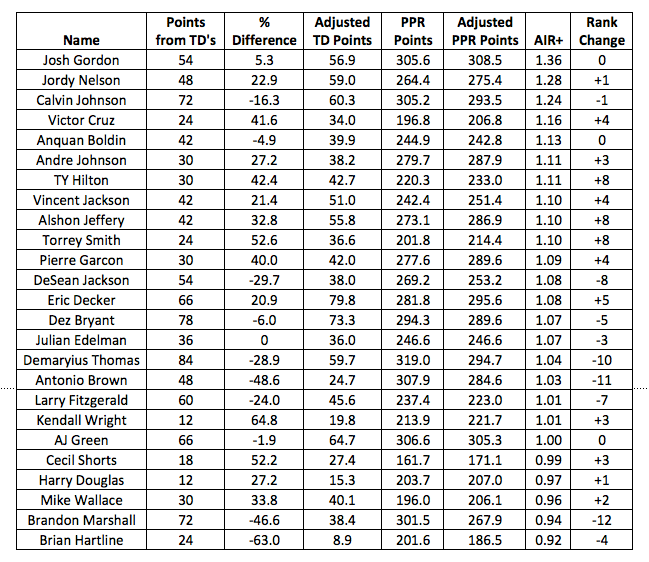
In that vein I’ve created a new metric, dubbed AIR+, which replaces the red touchdown variable in the AIR equation with a point total derived from an “expected touchdown production.” This swap will effectively take into account the “% difference” values in the table above as a multiplier on the 2013 touchdown totals, successfully bridging the gaps formed from aberrant production on both ends of the scale. As such the AIR+ metric will not only describe a player’s yearly production, but also essentially account for any deviations from normal scoring abilities – the downstream effect is a rough approximation of said receiver’s future outlook.
With that preamble in hand, I’m not generally in the business of massaging statistics into something they’re not. The creation of AIR+ certainly does just that, but this is in an effort to harness some sort of predictive ability. I fully recognize AIR+ for what it is – a highly educated guess with an eye towards the future.
Nevertheless, I need to mention an extra bit of subjectivity I’ve injected into the AIR+ equation. If a player’s points from touchdowns rise or fall, it would inherently stand to reason that the offense’s total points from passing touchdowns (shown in blue in the AIR equation) should do the same. However, I’ve declined to alter that total, making the perhaps prejudiced jump to a belief that, quite simply, the touchdowns would’ve either come from or gone to someone else – doing this shouldn’t have an overlarge impact on the resultant AIR+ value, but in the interest of transparency it’s important to mention.
Having now effectively prefaced the AIR+ metric, let’s get to the resultant values (shown in descending manner in the second to right column). The table below not only provides the results of this new metrical treatment, but also shows the exact change in point totals from touchdowns. Finally, the difference in ranks between the AIR/AIR+ metrics is shown in the rightmost column.

With an attempt to filter out the mundane, I’ll attempt to highlight a few guys whose movement is important to note:
Jordy Nelson – While Nelson only moved up one spot, this ascension to the number-two slot represents a large percent difference. Coupling with this Gordon’s likely absence and Nelson could very well be 2014’s best breakout candidate.
Victor Cruz – I’ve yet to find a metric or shred of empirical evidence that doesn’t support a 2014 re-emergence for Cruz. Falling just short of the “elite” AIR+ tier, he nevertheless exudes potential to perform well above his draft status.
Andre Johnson – Johnson isn’t known for his scoring in general, but it hit a relative low in 2013. Ryan Fitzpatrick could actually represent an upgrade at quarterback, and Johnson stands primed to yet again function as an elite fantasy scorer.
TY Hilton/Alshon Jeffery – Each profiles as a better scorer than they showed last year. Should this deviate back to the mean, expect another step forward for this pair of soon-to-be third-year players.
Torrey Smith – Scoring at a clip roughly half his norm, Smith nevertheless still functioned as a slightly above average receiver within the Baltimore offense. If he returns to his previous form, he could be in line for a true breakout in year four.
DeSean Jackson/Antonio Brown – Each should still increase their market share, but they will need to repeat their respective levels of aberrant scoring to truly flourish once again.
Demaryius Thomas – This could wind up a wash due to the mitigating circumstances of Eric Decker signing with the Jets. Regardless, if his touchdowns drop to expected levels he might not be as efficient as he was in 2013.
Larry Fitzgerald – “Only” a 900-yard receiver in 2013, Fitz scored at levels way too high to sustain.
Brandon Marshall – Marshall represents perhaps the most startling change on the list. With that said, his 2013 finish masked an 18% drop-off in receptions (compared to 2012) as well as huge increase in scoring proficiency. Perhaps the former will revert back to the norm as well, but there are definitive warning signs here.
Conclusion
As I mentioned at the onset of this project, my goal for this miniseries was to present outside-the-box methodologies for evaluating the receiver position. Ultimately, I believe I was able to afford unique views as they relate to volume dependence and the importance of touchdown percentages, culminating in predictions for 2014 breakout candidates. While no rule or metric is infallible, it’s my belief we should nonetheless be constantly expanding the boundaries of what we think we know about fantasy football – whether you agree with the findings of this study or not, I hope at the very least I’ve provided some food for thought.
Follow me on Twitter @EDH_27
[/am4show]
- Dynasty Fantasy Football Mailbag: Justin Jefferson Or A Bundle Of Draft Picks? - April 23, 2024
- Dynasty Fantasy Football Mailbag: Is Kendre Miller Valued Unfairly? - April 17, 2024
- Forgotten Dynasty Veterans: Bottom Tier - April 9, 2024


