The Dynasty Doctor: Quarterback Injuries
The NFL is constantly changing and we need to change with it. The success of our dynasty teams depends on many variables, but winning is about seeking to understand the DNA of the game itself. We’ve heard much about a new era of NFL football, with more mobile quarterbacks, read-option game plans, and are now watching with eyes wide open as the NFL changes yet again. Or, do we have our eyes closed? I’ve often thought increasingly mobile quarterbacks would lead to more injuries. In the current age of the NFL salary cap, it seemed crazy to me that an NFL franchise would give a huge contract to a quarterback who would might be at much greater risk of injury, like Robert Griffin III. Are mobile quarterbacks endangering themselves and those franchises who pay them? Or, do I have it backwards? I decided it was time for a test.
Here is my hypothesis: Mobile quarterbacks are more likely to get hurt and any offense that uses the quarterback in a hybrid role won’t last.
Here is how I constructed this study:
- I reviewed data available on Pro Football Focus for quarterbacks between 2008 and 2012. I focused on only those quarterbacks with at least 100 pass attempts per year. In this way, I could be assured of getting the most consistent data by removing players with limited game exposure.
- I separated those quarterbacks who played 16 games from those who missed any game time.
- I reviewed injury reports for each quarterback who missed one or more games at KFFL.com. The injury database at KFFL.com is fantastic and easy to navigate.
- I separated out those quarterbacks who missed games due to injuries and those who were missing games for reasons other than injury (coaching decision, replacing an injured starter).
- I wanted to test variables specific to the quarterback like rushing attempts, passing attempts, age, height, weight and offensive line performance, relative to injury frequency for each player on my list.
- The end result: 214 quarterbacks met criteria as subjects for this study.
Injury risk for quarterbacks is influenced by two inherent functions, running and passing the ball. In recent years, it seemed like NFL offenses drifted into more pass-heavy schemes. I collected data for passing attempts per year, between 2008 to 2012, and these are the results (Table 1)
Table 1

These data show pass attempts are steadily increasing in the NFL, and the rise is particularly sharp between 2011 to 2012. Could more pass attempts lead to more injuries? Quarterbacks drop back to pass, but are they hit more frequently as a result? We need more data to answer this one, but let’s look at rushing attempts by quarterbacks before we move forward.
NFL fans and dynasty competitors have no doubt noticed quarterbacks are used not just to pass, but seem to be running now more than ever. Quarterbacks aren’t just trying to evade pressure or scramble to pick up a couple yards for a new set of downs. Quarterbacks are now being used as a component of a rushing attack, giving offenses greater flexibility and defenses more headaches. If this is true, we should see an increase in rushing attempts by quarterbacks, and this is confirmed (Table 2):
Table 2

Table 2 shows how rushing attempts by quarterbacks have steadily risen since 2009, with a sharp increase between 2010 and 2012. The NFL game is changing on the field, and our dynasty teams are evolving with it.
For fantasy football owners, passes + rushes + touchdowns = points. Owners who most successfully exploit this equation win titles. But, as we all know, injuries can wreck a sterling plan. Should dynasty owners seek out hybrid quarterbacks, or stick to the traditional (translated: safer) pocket-passers for their teams?
I recorded all rushing attempts for each subject in this study. I separated quarterbacks in my data set based on a range of rushing attempts, looking for trends that might materialize. The end result is shown in Table 3:
Table 3

QB range of rushing attempts
Rushing attempts look similar until you look at the last two columns. The sample size is small, but in the past three years, there have been seven quarterbacks with at least 81 rushing attempts per year, whereas none were noted in 2008 and 2009. But, we need to take it a step further. I combined the data set on injuries with rushing attempts, and charted out the results on Table 4:
Table 4

- Injury must result in at least one game missed same season.
- QB range of rushing attempts.
The first six rows are the raw data, the number of quarterbacks sustaining injuries per year, within each range of rushing attempts. The last row is the incidence per column, calculated by dividing totals for each column in Table 4 by totals in the same column from Table 3. A trend can be seen, with two of the last four columns showing a drop in injuries, despite rushing attempts increasing. In fact, 36% of quarterbacks with 40 or fewer rushing attempts were injured, while only 25% of those who ran it 41 times or more sustained injuries. These data show fewer quarterbacks were injured who ran it 41 times or more.
If quarterbacks who run the ball are less frequently injured, then are pocket passers more likely to get hurt? We will now take a look at passing attempts relative to injuries at the quarterback position. Table 5 breaks down the number of quarterbacks within a range of passing attempts, from 100 to beyond 600.
Table 5

- Range of QB passing attempts
- Total number of quarterbacks evaluated per year
Table 5 shows an increase in the range of quarterbacks with 501-600 and 601+ pass attempts in 2011 and 2012. Between 2008 and 2010, the average number of quarterbacks with 501 or more pass attempts was 11, whereas in 2011 and 2012, the average jumped to 17.
We have shown that quarterbacks are passing now more than ever, and it does not seem to be slowing down. I thought a rise in pass attempts might place a quarterback at greater risk to take hits and sustain injuries. But then I reviewed the data in Table 6, and now I’m not so sure.
Table 6

- Injury must result in at least one game missed same season.
- Range of QB passing attempts.
The total number of quarterback injuries looks steady from 100 to 500 pass attempts. The last two columns are interesting, as quarterbacks with 501 or more pass attempts had the least frequent injuries. Sample size is not an issue here, as the 501-600 range had the most number of quarterbacks, and yet only 13% sustained injuries over five years. Furthermore, no quarterbacks sustained injuries who passed it more than 601 times. Contrast that with quarterbacks in the 201 to 400 range, with 59% sustaining injuries over the same period of time. Could this indicate these quarterbacks are playing for bad teams? It seems like these players would be passing more, as such teams should be in catch-up mode most of the time. Still, poor pass blocking might impact the ability of bad teams to execute an effective offense, and therefore exposing their quarterbacks to greater risk of injury. I reviewed injuries to all 34 quarterbacks in this range, and the combined record of these teams was 172 wins, 291 losses, for a paltry 0.371 winning percentage. Now we know that quarterbacks on bad teams may be less likely to pass, but they also tend to get hurt more often. From a production standpoint, it’s hard to start a quarterback from a bad team, given the risk of taking a hit in points and, even worse, when that player is out with an injury.
While on the topic of poor performance, pass blocking efficiency (PBE) should theoretically have an impact on the health of a quarterback. I collected PBE for all quarterbacks in my data set relative to their team for each year. The results are interesting, but not altogether surprising (Table 7).
Table 7
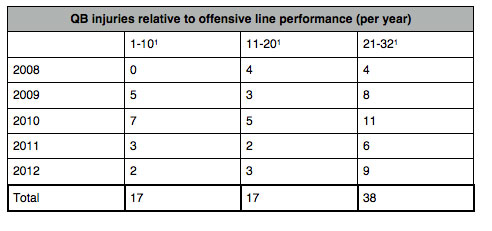
1.) Ranking from 1 to 32 in pass blocking efficiency from ProFootballFocus.com
There clearly is a significant correlation with quarterback injuries and PBE, as the worst offensive lines in this metric got their quarterback hurt more often compared to those teams with PBE in the top 20.
The remaining variables left to explore are injuries relative to height, weight and age. Once we have an understanding how these variables might predict injuries, we can develop a strategy to identify the most important factors in evaluating quarterbacks on our fantasy teams for future risk of injury.
Evaluating the impact of height on injury risk is relatively simple, as height is a static variable, unlikely to change much over the course of a career. Table 8 represents the summation of height in inches for all quarterbacks in my data set, a total of 214.
Table 8
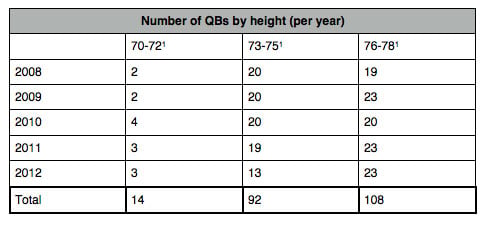
- Range of QB height expressed in inches
It is easy to see, in the NFL, size matters. 93% of quarterbacks in my data set were at least 73 inches or taller. The question is, are quarterbacks with short stature more or less likely to get injured? The results are presented in Table 9, and they might surprise you.
Table 9
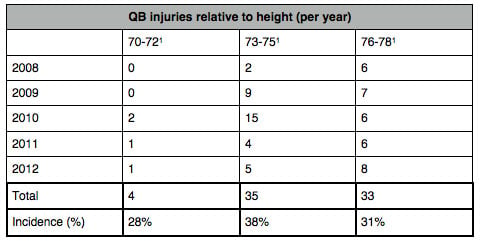
- Range of QB height expressed in inches.
According to this data, the lowest incidence of injuries was noted in the group with the shortest quarterbacks. How could this be? Are these quarterbacks better at evading pass rushers? Are they hard to see? More mobile? Or, are they on better teams? A closer look reveals that 3 of 4 injuries were to one quarterback, Michael Vick. Out of 14 total quarterbacks 70-72 inches tall, over a time span of five years, a total of one injury occurred to a quarterback in this group not named Vick. Maybe Russell Wilson was right, size is overrated, at least in terms of injury risk.
The next factor is age. In dynasty, we often obsess over age, but we’ve learned over years that quarterbacks carry production longer than other skill positions. It is tempting to believe that older players are more fragile, and at higher risk for injury. Dynasty owners might run for the hills thinking that players like Peyton Manning might fall apart at any minute. Is this fact or fiction? I collected the age of each player in my data set, and separated them into a range of ages measured in years. In Table 10, you can see that either youth is desired in the NFL, or older quarterbacks are getting thinned out by attrition.
Table 10
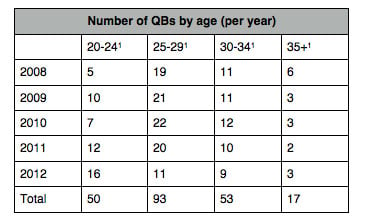
- Range of QB age expressed in years
67% of quarterbacks over the past five years are 29 years old or younger. In fact, only 8% of quarterbacks are 35 years old or more. Clearly there is a significant loss of volume for quarterbacks who hit 35 years old, with a 70% reduction in total quarterbacks from 30-34 to 35+ years old. How are these old guys responding to hits? Table 11 shows this data:
Table 11
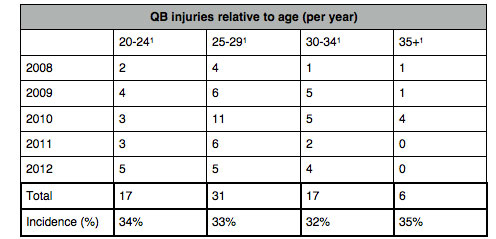
- Range of QB age expressed in years
It appears that injuries to quarterbacks occur fairly evenly across all age spectrums, and thus the notion that older quarterbacks are fragile or more susceptible to injuries may not be true. Of course, given the sheer reduction in total numbers, we could speculate that by the time a quarterback reaches 35 years, his less sturdy colleagues have been weeded out, and those who remain are unusually capable of withstanding the abuse characteristic of the NFL. At the very least, we might have to re-think the notion that older quarterbacks are more apt to get hurt, and dynasty owners can sleep easier knowing that Peyton Manning’s arm isn’t going to fall off on the 50 yard line.
Lastly, we will take a look at weight as a variable for injury risk. The majority of NFL quarterbacks weigh between 221 and 240 pounds. The full set of numbers are seen in Table 12:
Table 12
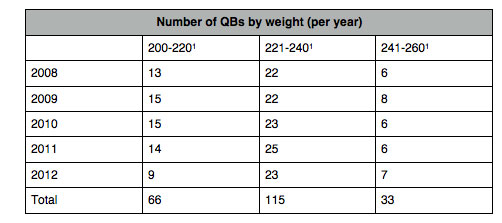
- Range of QB weight expressed in pounds
There is a trend for more frequent injuries to quarterbacks who are lighter in weight, as can be seen in Table 13.
Table 13
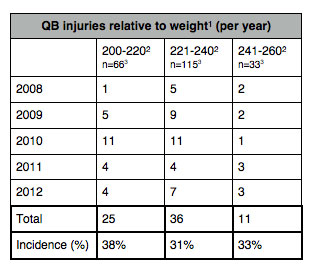
- Weight assumed to be the same across all years
- Range of QB weight expressed in pounds
- Total injuries 2008-2012 per weight range
38% of quarterbacks listed at 200 to 220 lbs. were injured the past five years, compared to 31% and 33% for those in a higher weight range. This is one example of prevailing wisdom proven to be correct. Concern over lighter weight quarterbacks being at greater risk of injury appears to be justified.
This data set supports the following:
- The hypothesis that mobile quarterbacks are more prone to injury is false.
- A higher number of pass attempts does not adversely impact injury risk for quarterbacks.
- Variables most predictive of injury to quarterbacks are teams with poor pass blocking efficiency and lighter weight quarterbacks.
- Variables that do not predict greater risk of injury to quarterbacks are short stature, age, higher than normal rushing and passing attempts.
I have to conclude that concern over greater risk of injuries to increasingly mobile quarterbacks may be exaggerated and untrue based on this data set. I do want to give thanks and credit to KFFL.com and ProFootballFocus.com for keeping track of injuries and statistics to make projects like this possible.
- Dynasty Capsule: Carolina Panthers - February 3, 2017
- The Dynasty Doctor: CJ Anderson - January 25, 2017
- The Dynasty Doctor: Week 15 - December 20, 2016


