Worth Every Penny

Even accounting for price, wide receivers outperform running backs in dynasty.
One of the best things about writing for DLF is the quality (and tone) of the feedback in the comments section. My very first article for DLF discussed the history of running backs and wide receivers in dynasty. It concluded the recent trend of owners valuing wide receivers is not an overcorrection, but merely a sign owners have (finally) come to their senses. However, several commenters rightly noted I was ignoring the small matter of scoring points, which is apparently important in some leagues.
This article fills in the gap by exploring production value — as in fantasy points — by position. To begin, I assembled a spreadsheet including every player drafted in the first 20 rounds of dynasty startups from 2007 to 2014; his average draft position (ADP) each year he was drafted; and his fantasy production in every year he averaged more than three points/game in PPR scoring.
Using this data, I calculated each player’s seasonal production value (V) for every year through 2014. V = games played*(points/game – baseline), where baseline scoring is 11 points/game for wide receivers, 10.5 points/game for running backs, and 9.5 points/game for tight ends. These baselines are premised on a 12-team league with two starting running backs, three starting receivers, one tight end and one flex. They roughly correspond to WR40-45, RB30-35, and TE12-15. Note: three-year value is just the sum of a player’s values over the first three years following a startup.
Here’s how the positions stacked up:
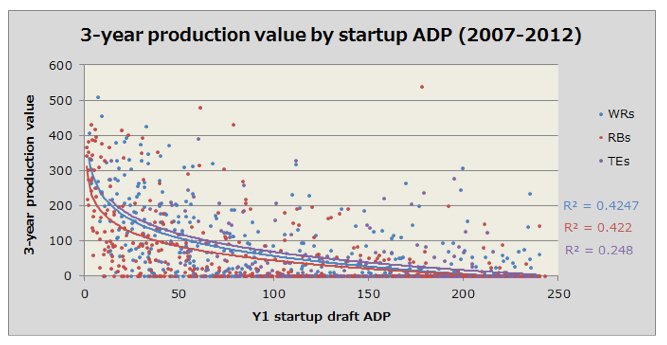
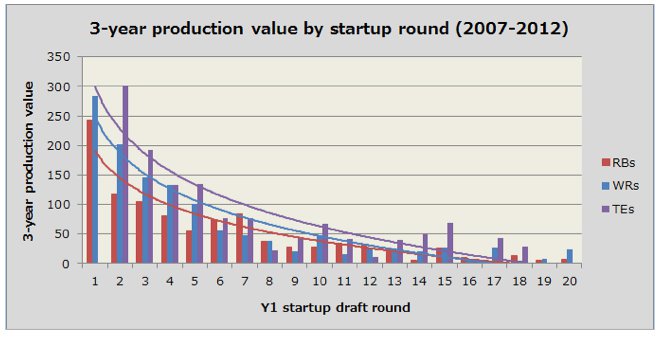
2007-2012 Startup Drafts (Three-Year Window)
[am4show have=’g1;’ guest_error=’sub_message’ user_error=’sub_message’ ]
The data show that startup drafters from 2007 to 2012 overvalued running backs and undervalued tight ends and wide receivers. (Look at all those red dots in the bottom left of the chart!) This shouldn’t surprise anyone. As I explained in my first article, startup drafters in the 2000s were insane. So let’s move toward more “enlightened” years.
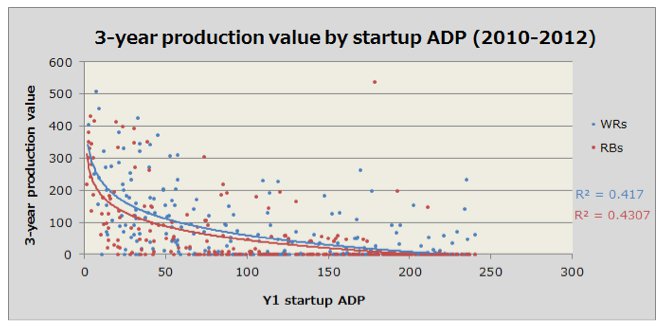
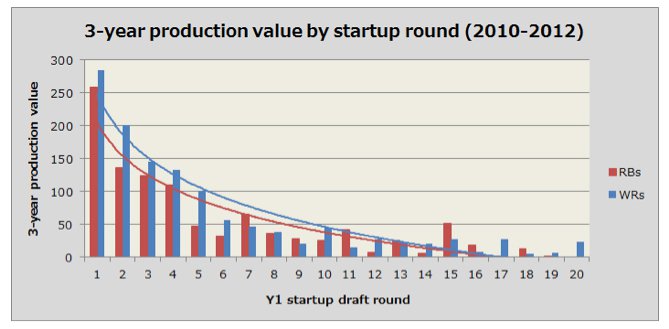
2010-2012 Startup Drafts (Three-Year Window)
Welp. That didn’t change much (except we had to drop tight ends because of small sample size). The data show dynasty drafters were still undervaluing wide receivers in the last few years, though maybe slightly less than they did in the late ‘00s.
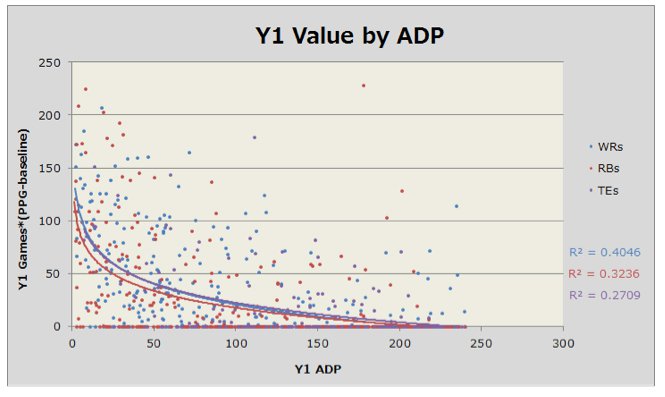
2010-2014 Startups (One-Year* Window)
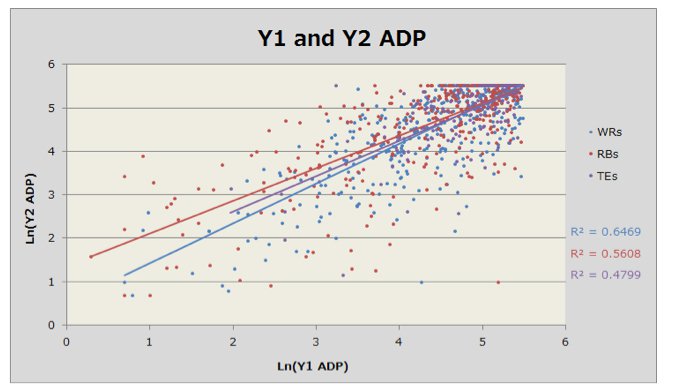
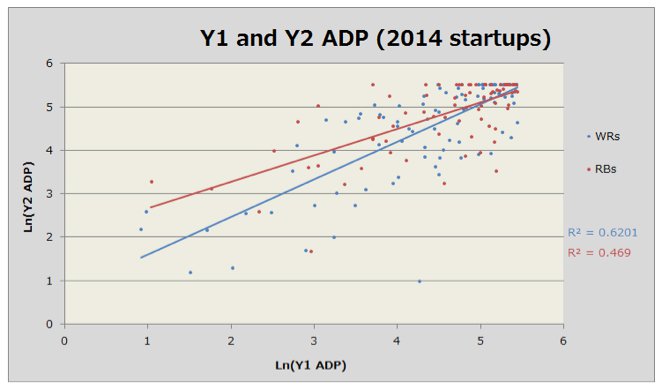
Unfortunately, 2012 is the last year that allows us to look at players’ three-year values. But if you’ll allow me to consider ADP as part of the equation, we can look at more recent data. In short, we can look at a players’ performance in the first year following a startup, coupled with their year-two ADPs, to evaluate the value of the investment.
Seriously? Will we never learn? Even ignoring future value, early-round wide receivers outperformed early-round running backs by a fair margin. Once we look at ADP from the following off-season, there’s really no contest. Wide receivers are more predictable, they’re more likely to meet early-round expectations and they retain their value better from year-to-year.
Maybe, just maybe, we figured things out in the last couple years.
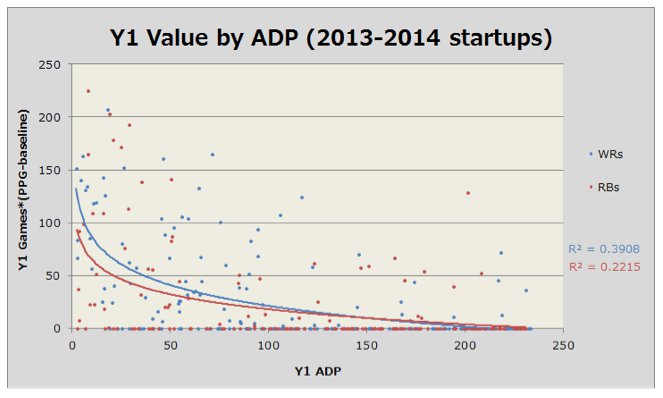
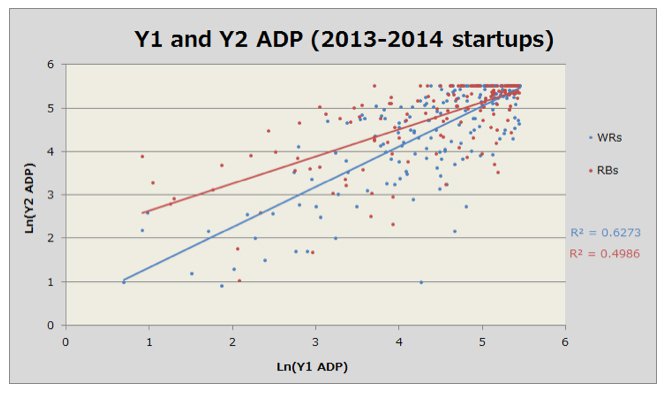
2010-2014 Startups (One-Year* Window)
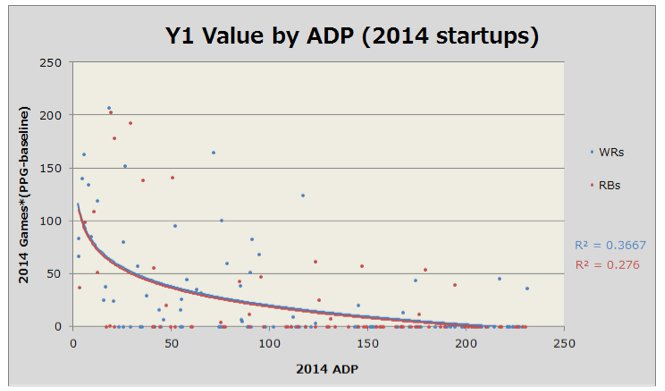
Oh, right. Trent Richardson. Doug Martin. That’s not really fair. I know the sample sizes are getting pretty small, but let’s look just at 2014 startups. That’s really the best way to measure the pulse of the dynasty community, isn’t it?
2014 Startups (One-Year* Window)
Hey, now there’s something!
Sure, wide receivers may retain their value better than running backs. And, sure, these sample sizes are pretty small. But look at those value curves, will you? Can’t get much closer than that. I think dynasty drafters have finally gotten the wide receiver-running back balance right! At least we’re much closer than we used to be.
Wait a Minute …
One assumption underlying all of these pretty value charts is the baseline levels of production for each position are correct. If the baseline for running backs should really be, say, 10 points/game instead of 10.5, then those running back value curves get a fairly substantial bump up the y-axis.
But, if anything, I was generous in setting the running back baseline below the baseline for wide receivers – they should probably be equal. After all, most leagues allow lineups with at least one flex spot. So the only way the running back baseline should be less than the receiver baseline is if the last flexible wide receiver is outscoring the last non-flex running back. That’s not the case. I nevertheless gave running backs a 0.5 points/game handicap because running backs get hurt more frequently, so a below-baseline running back who can fill in spot duty has more value than an analogous wide receiver. Most importantly, I wanted to insulate myself from accusations that I was stacking the deck in favor of wide receivers.
Conclusions
Looking at actual production supports the notion that dynasty drafters have long undervalued wide receivers relative to running backs. Indeed, up until 2013, wide receivers were systematically better value for the cost in startup drafts.
Data from 2014 startups suggests that maybe, finally, drafters have properly adjusted and are valuing wide receivers appropriately. At least running backs kept pace in year one. Still, even limiting ourselves to 2014 startups, wide receivers maintained their dynasty value better than running backs, which indicates dynasty owners think the receivers were better buys back in 2014. And as this article shows, dynasty ADP is a pretty good predictor of immediate production.
Nothing in the data suggests drafters have overcorrected and are now taking receivers too early. So while it’s often beneficial to zig when others are zagging, in this case you’re likely better off sticking with the zaggers.
[/am4show]
- Dynasty Capsule: Miami Dolphins - January 26, 2019
- Dynasty Capsule: Buffalo Bills - January 21, 2019
- Dynasty Capsule: Carolina Panthers - January 21, 2018


