Searching for Consistent Greatness: A Summary (Part Two)

In the past few months, I have looked at the weekly scoring of quarterbacks, running backs, wide receivers and tight ends (in two parts) to determine which players have performed the best over the last three years. Here, I summarise the findings and collect some thoughts. Before reading further, make sure you check out part one.
On ‘Consistent Greatness’
A dictionary definition of ‘consistency’ will say “staying the same,” “evenness” or “lack of change.” However, a distinction between ‘real-life’ consistency and what we were searching for in this study must be made. We were not looking for a low standard deviation or how often a player gives us the same thing – instead, how often they exceed a certain number of points and what that says about how they score their points. My concern is to fill my rosters with players who give me the best chance to score the most points every single week.
[am4show have=’g1;’ guest_error=’sub_message’ user_error=’sub_message’ ]
Studies by Adam Harstad at Football Guys and our Brian Malone have indicated having a team of players who score the same number of points ‘consistently’ doesn’t provide a statistical advantage over one whose players are inconsistent. Harstad’s piece suggested most fantasy games are decided by blowouts (so you need big individual performances) and Malone’s determined “you’re much better off owning a player who gives you an inconsistent 15 points-per-game than one who gives you a consistent 14.25 PPG,” and consistency doesn’t matter much if you compare two players with the same PPG.
So, ideally, when searching for ‘consistent greatness,’ you’d like a player who has a strong weekly baseline and mixes in some huge game-winning performances. I am not saying we can predict consistency (multiple factors add up to points every single week), but this series gives us an idea of who has been scoring above ‘x’ number of points in the past. If we found out that a player scored a lot of points in one or two games, it has been a helpful exercise. If we realize that despite a lack of big games, a player has given a consistent floor over a long period of time; it has been a helpful exercise.
On Cross-Positional Comparisons
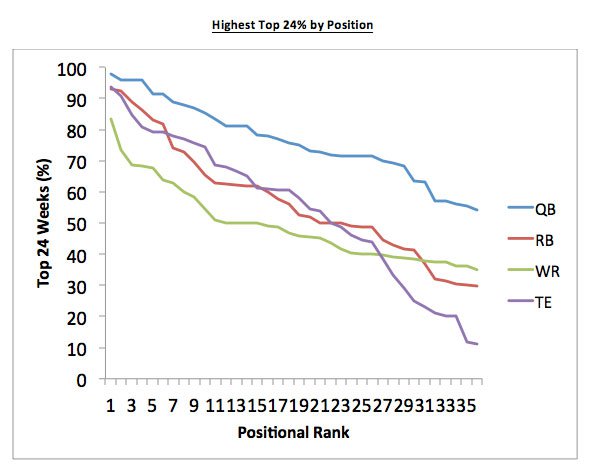
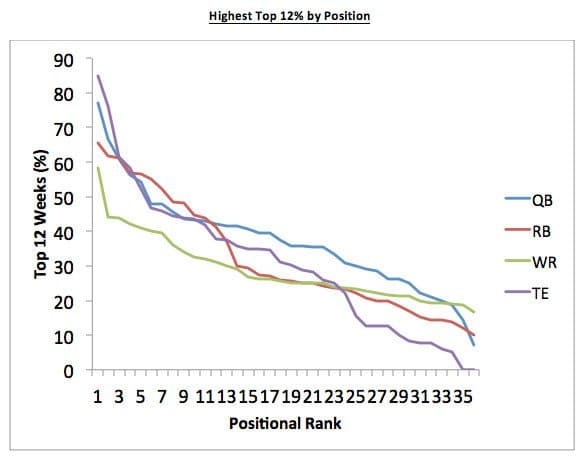
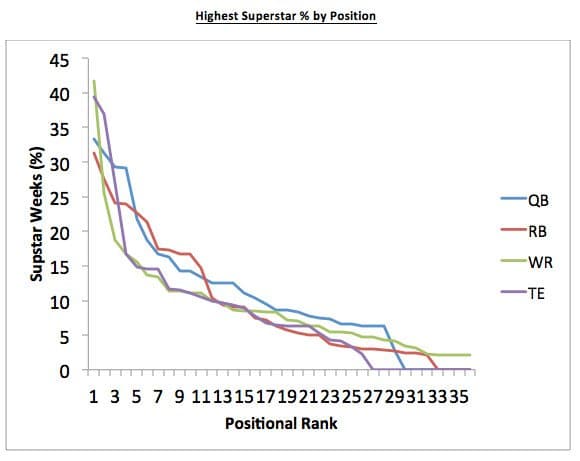
Here, I strip away the names of the top 36 players in each category to compare these ‘consistent greatness’ percentages across positions:

- Quite clearly, this enforces the idea that there are a lot of quarterbacks that will be in the top 24 a high percentage of the time, meaning you can wait/not invest highly
- Tight ends have a bigger drop as we get deeper, but it seems as though running backs and wide receivers drop further at the top
- Wide receivers even out a lot more, and as we reach the lower ranks, they still have reasonable top 24 percentages

- There are steeper drops at tight end and quarterback than the other two positions, going against the idea that we can wait on them. Since quarterbacks last so long and Andrew Luck could be at the top of this curve for years to come – can a case be made that he is the top dynasty asset?
- After the first receiver (Odell Beckham Jr), the decline is not so steep
- The running back, wide receiver and tight end percentages all merge around the 24 mark. Since running backs have higher percentages before then, and have a steep yearly drop as evidenced earlier, I believe they are the most important position in order to win

- After having the lowest percentage at number one, running backs ranked in the top 12 have high superstar percentages
- The wide receiver and tight end drops at the top are huge (thanks to some outstanding talents)
- The receiver depth again shows, as the chance of a superstar week continues past the top 36 players
On Flaws and Interpretation
Like any study, this is just another way of interpreting data, and everyone will value it differently. Some people follow fantasy points per game, some look at yards, some value PFF grades and some are simply chasing touchdowns. My view is: if you are focusing too much on one thing, you are missing out; but if you ignore any one thing, you are missing out as well. We must consider statistics, player talent, athleticism, team, scheme, coaching, teammates, opponents and so much more. While I will continue to focus time looking at gameweeks versus yearly scores, it is just another piece of the puzzle.
Any number of statistics or tables can be used as ‘facts,’ but how we interpret them is the fun part and the more telling part. I like to use Jeremy Maclin as an example of how people used facts in different ways. Before 2014, he had never had a 1000 yard season. That is a fact. However, I saw it used as a concrete reason that he wasn’t a good receiver as he never hit that particular cut-off point: “Maclin has never gone over 1,000 yards, therefore he isn’t that good.” This statement ignores both that he had over 850 yards in three of four seasons and had a top 14 fantasy season with 964 yards and ten touchdowns. In that season in 2010, his teammate DeSean Jackson did go over 1,000 yards, but ended up seven spots behind him as the WR21 on the year. So, while I understand that I can say ‘Player X didn’t make my top 12 list in ‘Category Y’; I realize he may have missed a baseline by one point, or placed in thirteenth. The baseline numbers, although calculated clearly and with a particular reason, are an arbitrary cut off point for ‘success’. A wide receiver could score 14.6 every week and they would have a 0% success rate as a ‘WR2’, but it would obviously be a successful year (note: no player did that, and if they would, I would definitely have mentioned it).
Why are weekly scores so important?
I have used various examples of yearly deception throughout the series, but another example is Brian Hartline in 2012. He finished the year with 1,083 yards and 188.3 fantasy points, but 253 of those yards and 43.3 points (23% of both) came in one game in Week Four. Why three years? Looking back on a game week four years ago (Week Five in 2012, for example), the top wide receiver scorers were Reggie Wayne, Marques Colston, Brandon Marshall, Percy Harvin, Wes Welker and Victor Cruz. Older players can fall off in an instant and things change very quickly within such a short time. We can use any period to illustrate a point, but I went with three years.
On the Series
How do we use this moving forward? Just like any newly discovered information, it does affect my rankings. For example, I knew CJ Anderson was good last year, but I didn’t realize how amazing he really was. Robert Griffin III is back on my radar as I believe he can bounce back with full health. I might give Jason Witten another chance, given his consistency prior to a down year. Players change, grow and decline. As things ‘stay the same’ for veterans, I tend to think they will continue at the same pace, but all players need for a radical improvement is the right scheme, coach, teammate etc. The approach is retrospective and naturally can’t be applied as fact or a predictor of the future, but it can certainly help. I hope it has helped you.
Thank you
Big thank yous to Ken Kelly for reading through the combined 20,000-plus words (wow) for this project, Karl Safchick, Eric Hardter and Jason Blanton for hosting me on the podcast to discuss the series, Cordarrelle Kritikos (aka George the Bubble) (aka @Rotohack) for his marvellous excel skills, Scott Fish; who developed a statistic tool just for me and to all the readers/listeners/followers who have supported me.
Thank you all!
[/am4show]
- 2022 Rookie Class: An Early Look at Kenny Pickett, QB Pittsburgh - January 31, 2022
- Dynasty Fantasy Football Rookie Update: Quez Watkins, WR PHI - July 15, 2020
- Dynasty Fantasy Football Rookie Update: John Hightower, WR PHI - July 7, 2020


