Buy the Numbers: Quarterback Pressure
“Pressure, pushing down on me, pressing down on you, no man ask for. Under pressure.”
I will pause before I even begin this article. If you didn’t know this was Queen (with David Bowie) or worse, you hate Queen, I recommend you stop reading and we end our friendship immediately. With that out of the way, let’s begin the next article in this series diving into various statistics.
Pro Football Focus (PFF) has tracked quarterback performance over the past eight years and have compiled data showing how they fare when being pressured by an opposing defense. The data includes completion percentage, touchdowns, interceptions, percent of dropbacks where they are pressured, and more (sadly, they do not track passing yardage so if any of them read this, a must add). Here, we will examine the importance of understanding how quarterbacks handle being pressured and what that means for your dynasty team.
Why do Pressure Statistics Matter?
Quarterbacks are pressured roughly one out of every three dropbacks (32.6%), which is no small number. The range is relatively tight as the minimum percentage is 18% (maximum is 47%), meaning even the best passers at avoiding pressure are still seeing it on one out of every five dropbacks. Because of that, any quarterback who sees a performance decline when pressured is going to be a more volatile fantasy asset. That volatility stems from matchups, changes on the offensive line, and of course, the quarterback’s own reaction to the pressure.
A view at pressure percentage for quarterbacks relative to the PFF’s pass blocking score reveal a moderate correlation (0.36) that trends in the way we would expect.
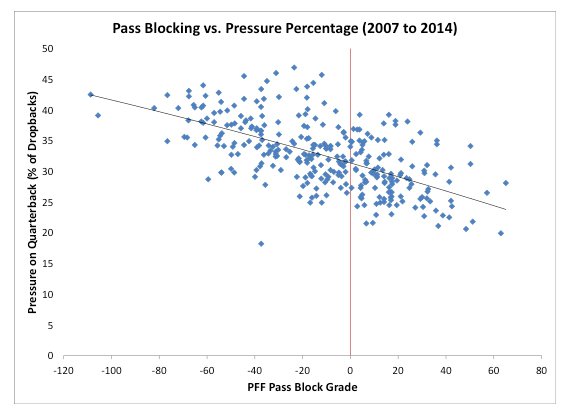
This tells us that if we are to assume that the PFF pass block grades are relatively comprehensive of the offensive line’s influence on deterring a pass rush, it implies that over half of the explanation of quarterback pressures is independent of the quality of the offensive line. However, that is still a strong enough relationship to be mindful of key changes to an offensive line each season.
How to use this information?
[am4show have=’g1;’ guest_error=’sub_message’ user_error=’sub_message’ ]
We will look at a few aspects of quarterback pressure here. Here are some questions I had looking into the data:
- Which data points are most useful in analyzing the reaction to pressure?
- Who gets pressured the most/least? Does this change greatly from year-to-year?
- Who handles pressure the worst/best? How much does it impact performance?
The first question is the easiest to answer based on the data available. At first, looking at touchdowns seemed logical but it relies greatly on field position, making it tougher to analyze. Instead, looking at accuracy percentage (completion percentage that takes into account wide receiver drops, balls thrown away, etc.) and interceptions is more telling. Those are less reliant on field position and should help understand how a quarterback responds to being pressured.
Below, I will highlight some key quarterbacks to help answer the remaining questions.
Russell Wilson
Why? Wilson has been the most pressured quarterback in both 2013 (43.8% of dropbacks) and 2014 (46.0%).
The Seattle quarterback sees a lot of pressure and he can put much of the blame on himself. Holding the ball for an average of 3.2 seconds per pass attempt the last two seasons is highest among NFL starters. Peyton Manning, by comparison, held it a league low 2.24 seconds in 2014 and was only pressured on 22.7% of his snaps.
Wilson is a highly accurate quarterback when he is not being pressured (77.1% in 2014, 74.5% in 2013) and does see a decline in effectiveness when he is pressured (62%, 66%). That decline seems large but he is still among the most accurate in both situations. Wilson does not, however, make bad mistakes as his interception percentage was among the lowest in the last two years both when he was pressured (1.8%) and when unpressured (1.4%).
My only concern with Wilson is the punishment he will take from all this pressure. In 2013 and 2014, he was hit exactly 94 times each season – among the top ten at the position both seasons. As he ages, it will become even harder to elude rushers with his athleticism, so he needs to get the ball out faster to avoid injury. It’s a low risk to be sure, but dynasty owners care about long-term production.
Andy Dalton
Dalton is the anti-Wilson in terms of being pressured. He has never exceeded a 26% pressure rate during any of his four years in the league. This helps immensely as he is accurate when faced with a clean pocket (between 74.2% and 75.5% every year) and struggles when the heat is turned up (accuracy lowers to 56%). He avoids the pressure with a low snap to throw time (2.39 seconds in 2014), which is crucial as interception rate is nearly double when he is pressured (career 4.4% vs. 2.7% when unpressured). Dalton assumes less risk of variance due to pressure as he operates so quickly in the pocket, another reason I feel he is underrated in dynasty leagues.
The 2014 Rookies
I figured it would be best to put them together for comparison purposes. Consider the following chart:

A few things I gathered from looking at the rookies. Teddy Bridgewater was pressured the most (39.9%) but his ability to handle pressure in terms of passing accuracy (75.2%, best in the NFL) and interception rate (2.1%) impresses me more than anything. My hope is Bridgewater improves his awareness to pressure and gets rid of the ball a little quicker (2.86 seconds, 8th longest in 2014) while maintaining his composure when he does see defenders in his face.
On the flip side, both Blake Bortles and Derek Carr struggled mightily in the face of pressure and give me pause considering they were above average in terms of pressure percentage overall. Improvement in their receiving options should boost their confidence when under duress but it is clear that they lack the decision making skills of a top tier quarterback at this point in time.
Geno Smith
Admittedly, I have been a Smith believer, but the numbers here scare me. He is pressured on over 40% of his passes (40.1% in 2014, 42.0% in 2013) and struggles with accuracy (50%, 55.5%) and interception percentage (2.9%, 3.2%) when he is threatened by the defense. He is highly accurate (78.4% in 2014, 71.4% in 2013) when he has a clean pocket but the interceptions remain (3.1%, 4.7%). The improvements, in some cases small, have me holding out hope that he figures it out. A good start would include getting rid of the ball sooner (3.1 seconds to throw, second behind Wilson), which would reduce the amount of passes under pressure.
Nick Foles
Foles went from a dreamy 2013 to a nightmarish 2014 before an injury halfway through the season put him on the injured reserve. It can be shown in his reaction to pressure, going from a 68% accuracy rate down to a 52% in 2014. This regression, though, wasn’t evident in his non-pressure stats as he stayed consistent with a 76% accuracy rate in both seasons. I won’t even point to the interceptions as everyone knew his 2013 total of two would rise. The point here is around how much a quarterback’s response to pressure can influence overall numbers.
Ryan Tannehill
Foles’ reaction to pressure sunk his 2014, but Tannehill showed the improvements you want to see. He improved his accuracy in non-pressure situations (from 73% to 78%) but more importantly, he showed gains in pressure situations as well (58% to 64%). Oh, he also cut down his interception rate under pressure from 4.5% to 1.6%. All this happened even with an increase in pressure situations (33.6% to 38.3%). Tannehill made huge progress in a breakout 2014 and showed that his decision making skills are trending upward.
Thanks for reading and feel free to leave comments about the article or ideas for future pieces.
[/am4show]
- Bowl Game Previews: CFB Playoff Semifinals - December 28, 2018
- The Narrative Fallacy and How it Compels Us - May 13, 2017
- 2017 NFL Draft – College Wide Receiver AIR - April 27, 2017


