Choosing a Fantasy Running Back: A Contact Sport
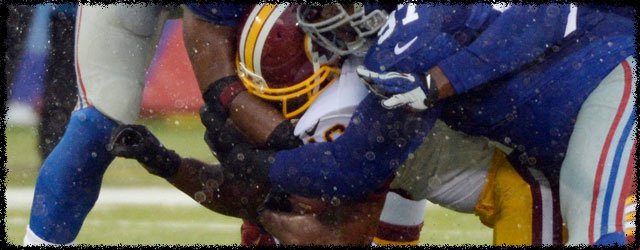
One of my favorite statistics in football is the dreaded 2,500 carry mark where running backs mysteriously erode and become ineffective. I have seen dynasty owners cite career carry numbers as a way to drive up or down the trade value of a specific running back. Even worse, I have seen owners trade away running backs for picks in the hope of restocking their team with fresher running backs.
What all of us know is that not every carry was created equal. By that I mean some carries involve significantly more contact and running backs have a subsequent rate of effectiveness with that contact.
Assuming that is true, then in theory, running backs may be more susceptible to decline based on their effectiveness when dealing with contact. Can we look at historical numbers to figure out the rate of attrition and figure out if a running back needs to be traded off so quickly?
Background
In order to investigate this further, we need to make sure that there is, in fact, a relationship between a running back’s experience and his performance. First, we need to create a statistical pool. In this case, it is the top 50 running backs (by rushing yards) annually from 2007 to 2013 which accounts for 350 entries from 128 running backs. Also, we will try to normalize statistics where needed in order to account for player injuries and other deterrents of playing time.
Now that we have some boundaries, let’s take a look at some basic information. Below, we see the average yards per rush based on experience level and see that there is a pretty strong negative correlation.
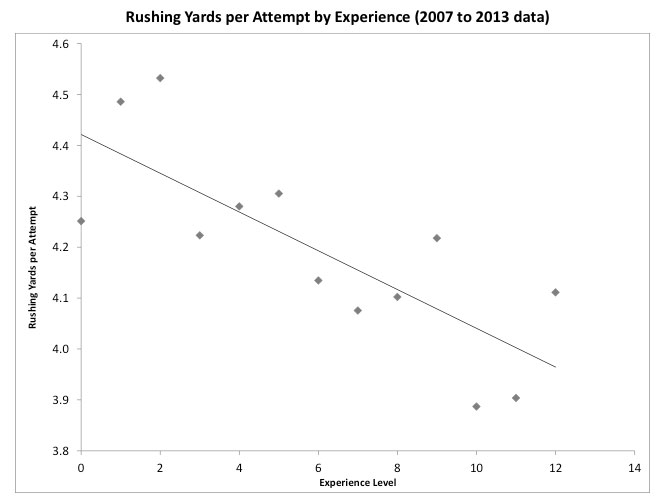
Understandably, the rookie season is a bit of an anomaly; something I would attribute to the initial adjustment from college to the NFL. However, over the course of a ten year career, we can expect a 10-15% decline in yard per carry performance. Seems insignificant, but when you think about a back receiving 300 carries, that can mean the difference between a 1,300 and a 1,100 yard season. That shift in performance, excluding any impact to touchdown stats, would have dropped Alfred Morris below DeAngelo Williams in fantasy scoring (no further explanation required).
Data Analysis
Since most leagues do not reward for statistics like missed tackles and yards after contact (which is at the crux of this article), we will bring it back to more fantasy relevant numbers. First, let’s look at the relationships of both rushing yards and contact yards relative to experience. The overall trends are the same (negative) but we see a greater decline in rushing yards over time. I think this shows that there is a relationship between running through contact to overall rushing yardage, but there is an additional contributing factor that may require a separate study to analyze.
[am4show have=’g1;’ guest_error=’sub_message’ user_error=’sub_message’ ]
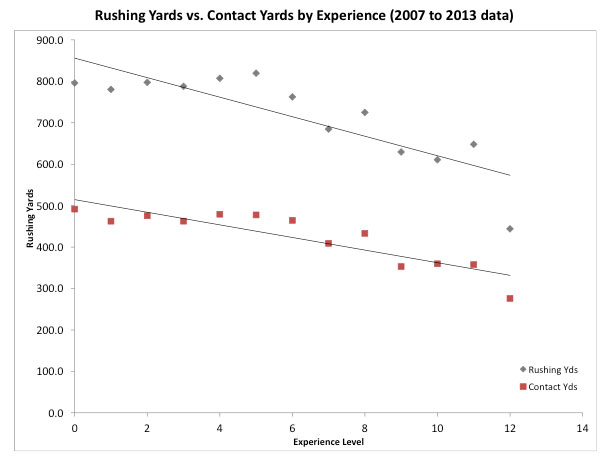
My first thought, seeing the information above, it that perhaps we are seeing a reduction in carries that is also resulting in decline in yardage after contact. However, when we look at the average yardage gained after contact, we see a similar trend.
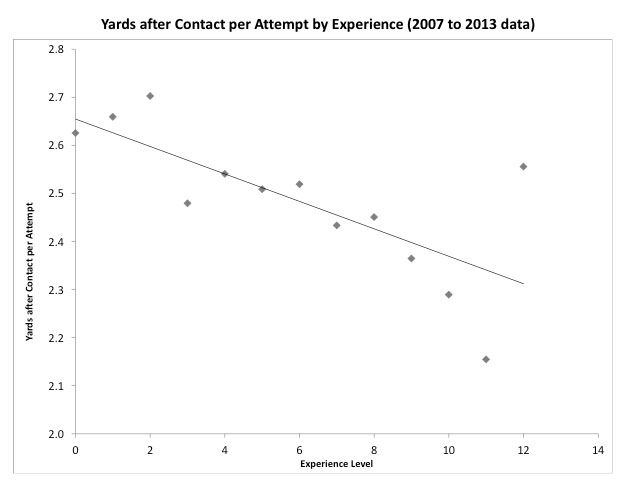
As you can see above, we have a very tight correlation to the ability to gain yards after contact relative to experience – this shows the impact of aging and wear on a running back’s body. It also can be an indicator of which backs are likely to experience age-related regression as a result of declining contact ability. Looking deeper into this, we also see how the various contact rates have an impact on performance.

As shown above, running backs with higher contact rates* average fewer yards per carry and are the lowest scoring fantasy running backs on average. They also predictably weigh more and are taller than other running backs. Low contact backs are smaller but average more fantasy points per game, likely a result of better receiving performance. What is interesting is that we don’t see a variation in rushing useage between the three tiers.
Switching gears, there is a similar pattern with experience and missed tackles. Much like the relationship with yards after contact, running backs see a decreased ability to force missed tackles as they progress in their careers.
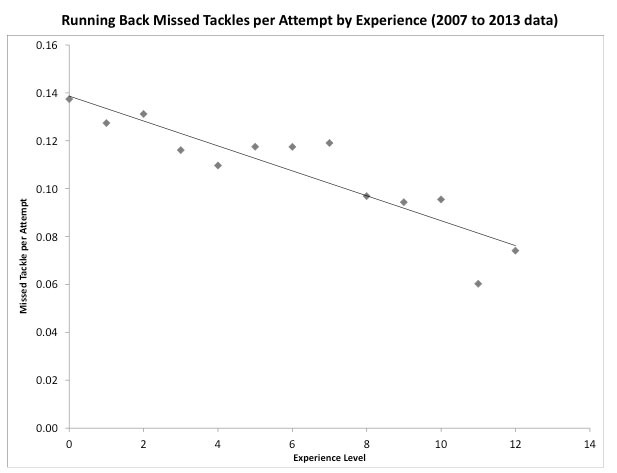
This again points to an opportunity to identify running backs at risk based on their reliance on forcing missed tackles to gain yardage. Again, looking at performance relative to missed tackle rates, we see some variation in key statistics.

While the high** and medium tiers have similar yardage totals, the higher tier gains it with less carries. The low bracket shows the greatest variation in performance with significantly less yards, touchdowns, and fantasy points per game compared to the others. This shows where we can look for risk.
Utilization
So looking at everything we learned, let’s try to apply a few things to the current crop of running backs. The first thing we know is that age presents a decline in contact skills; we can just apply that as needed. Let’s take a look at some of the harder runners in the league, identified by their total contact yardage.
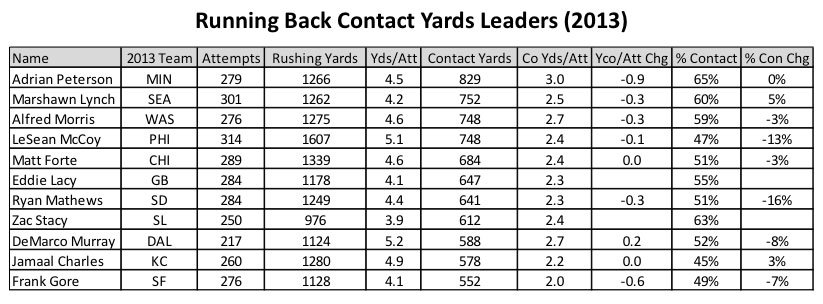
What is interesting here is that none of the top five running backs are seeing increases in yards after contact per attempt compared to last year. While Adrian Peterson shows a steep decline, it is in line with his average and is being compared against his historic 2012 season, so I wouldn’t read much into this. More concerning are players like Marshawn Lynch, Alfred Morris, Ryan Mathews and Frank Gore who all are at or approaching career lows in contact yards per attempt; signaling a decline. DeMarco Murray, on the other hand, increased his yards per attempt after contact, the only running back who managed to do so. I think it shows the level of skill he has when healthy as he also lowered his contact percentage, entering low territory.
Switching gears to missed tackles, below is a list of the players who created the most missed tackles in 2013.
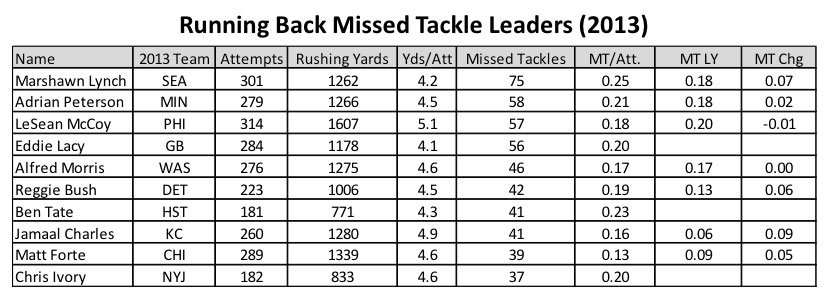
Lynch and Peterson again feature prominently and both saw improvements from their 2012 campaigns, surprising as you consider that both had elite level missed tackle per attempt figures already. My concern here is with Matt Forte, the only player on this list who does not have elite per attempt rates and actually qualified in the low portion of the category in 2012. Meanwhile, Ben Tate was second in the league in 2013 in missed tackles per attempt and could be a huge boon to dynasty owners in Cleveland if he can maintain that level of performance.
Lastly, let’s just see how the rookies of 2013 performed in these categories as a fun exercise.

Of the group of rookies, Eddie Lacy and Montee Ball are both showing near elite levels in both contact percentage and missed tackles per attempt. Andre Ellington and Giovani Bernard do not seem to have any red flags either. Le’Veon Bell does nothing at an extraordinary high level so he seems like an average player. Zac Stacy, on the other hand, has the highest contact rate and lowest missed tackle efficiency of all the rookies. If I had to recommend a sell on one of these players, Stacy is the candidate.
Conclusion
It is always difficult to apply a stat or two in order to determine the future of any player. That being said, there are some interesting takeaways that can help as you think about the long-term with your team.
- Does your running back get a lot of yards after contact? If so, the inevitable regression will likely hit him harder than most as he ages.
- Can your running back induce a lot of missed tackles? No? Then you are probably going to see an impact to performance that is greater than those that can.
- Is your older running back showing declines in yards after contact and missed tackles? Did you answer yes? Then it may be time to trade him off before the decline shows up in the numbers.
You can find these stats on Pro Football Focus or feel free to reach out with questions or ideas for future articles!
* Contact rates based on contact/rushing yards defined as >63.7% for “High”, <55.1% for “Low”, and between 55.1% & 63.7% for “Medium”
** Missed Tackle rates based on missed tackles/attempts defined as >.144 for “High”, <.095 for “Low”, and between .095 & .144 for “Medium”
Don’t forget to follow me on Twitter @Rotohack
[/am4show]
- Bowl Game Previews: CFB Playoff Semifinals - December 28, 2018
- The Narrative Fallacy and How it Compels Us - May 13, 2017
- 2017 NFL Draft – College Wide Receiver AIR - April 27, 2017


