Dynasty Deep Dive: Setting the Bar for Running Backs

This series first took a look at the quarterback position. We continue with the running backs, arguably the most valuable, as well as the most difficult to value. Expectations can vary wildly and the risk of injury, a timeshare, or Mike Shanahan constantly looming. Part one will take a look at the lifecycle of a running back, which is crucial in keeper and dynasty leagues as their value can suddenly and unexpectedly plummet.
A note before we get into the data: I am a proponent of PPR, so all data will be evaluated using standard PPR settings. For those of you in ½ PPR or no PPR leagues, much of the directional data will still apply.
Setting the Bar: Lifecycle
[am4show have=’p2;p3;p4;p5;p6;’ guest_error=’sub_message’ user_error=’sub_message’ ]
Unlike the quarterback, running backs are a much more volatile stock to invest in. Their learning curve is smaller, but their shelf life is significantly shorter. As you can see below, the rookie year represents the pre-prime portion of the average running back. That’s not to say opportunity is not a factor, but it does represent a need to be conservative when projecting a starting rookie running back.
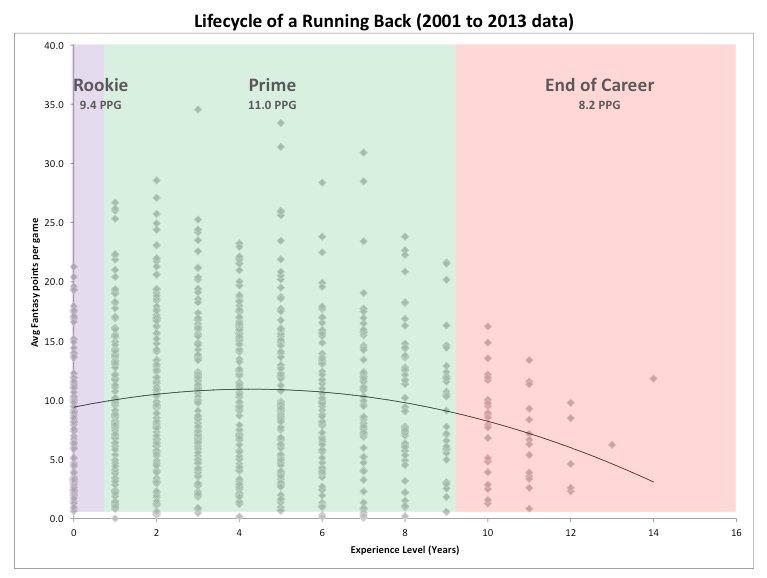
Looking more in-depth at the chart above, the first jump occurs between the first and second season. This represents a 17% increase in average scoring that remains relatively constant for the next eight seasons. This prime period can be interrupted by opportunity, scheme changes, or injury; but by holding those relatively constant, it shows that the capabilities of a running back tends to hold for an extended period of time. However, after the ninth season (right around the dreaded age 30 mark), there is a pretty precipitous decline that occurs where very few running backs have been capable of maintaining any level of success – this phase represents a 26% decline in average performance and will turn your starting running back into a flex or backup.
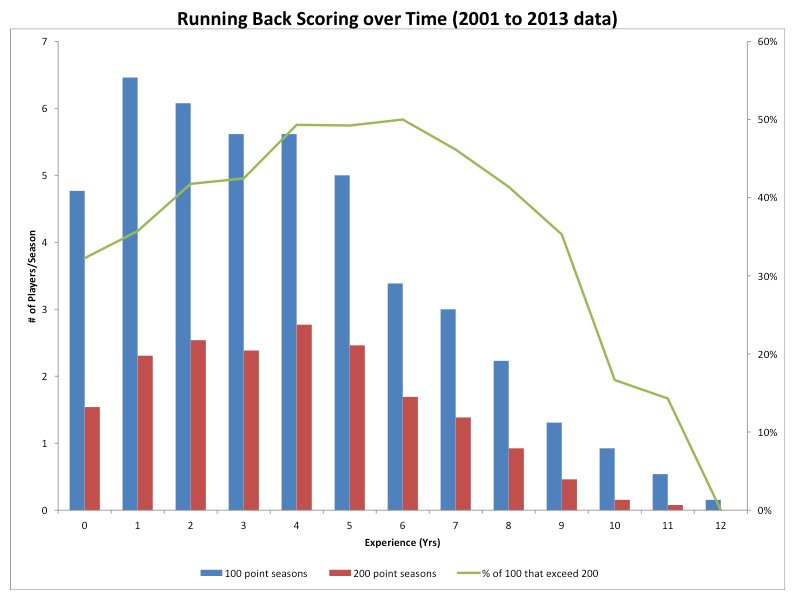
While this shows there is a clear useful life for an NFL running back, it doesn’t delineate between a starter and a backup. When looking at scoring over time, two thresholds stand out that can show the lifecycle of a starting caliber back and a reserve. Normally, I prefer to look at average points per game but in this exercise, we need to know total points to establish a starter vs. a backup.
When looking at the chart below, the 200 point barrier represents roughly 20 running backs a year, a good threshold for a starting caliber back. The 100 point mark encompasses about 45 running backs a year, this is enough backs to fill out most fantasy league rosters so we can call that the backup threshold. Both figures show a significant drop between the year five and six marks, indicating a decline in useful fantasy seasons after that time. Even the percentage of starters vs. backups declines in this timeframe, indicating it is increasingly risky to draft one as a starter.
Setting the Bar: Great Expectations
With the quarterback analysis having established an uptick in average fantasy production from the keystone position, the assumption has been that this is to the detriment of the running back. This, however, is where the league settings regarding receptions can be a key differentiator. When looking at the top-rated running back trends below, there is a decline that has occurred in scoring but why that is may surprise you.
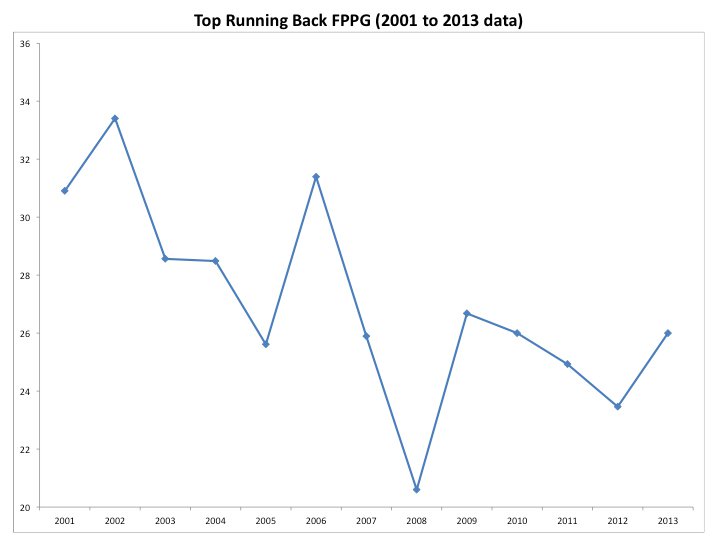
Common belief is that there has been a decrease in running back useage, but among the top running backs that is not the case. Carries have remained constant with overall yardage going from roughly 2,200 down to approximately 2,100, not enough to shift the average output (from 29.2 to 24.6). What we are seeing is a decrease in touchdowns and receptions, which corresponds with the recent trend of utilizing several specialized running backs on a team. With 20 fewer receptions from the top running backs and six fewer touchdowns in recent seasons, overall scoring has been distributed to other running backs on the team.
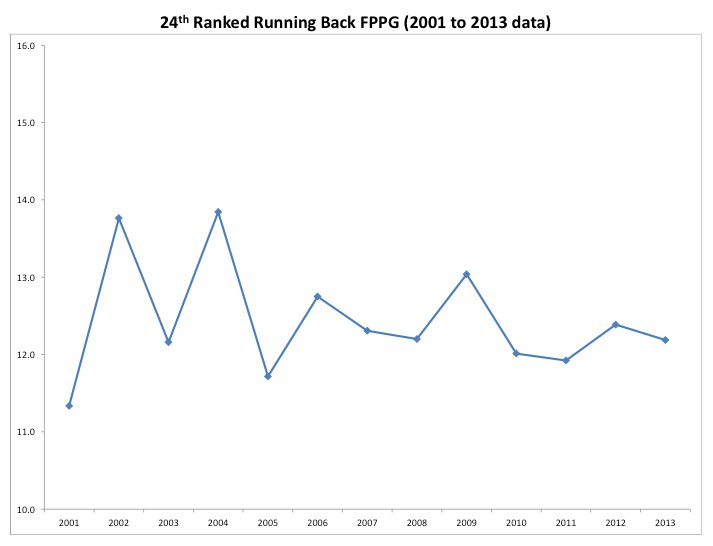
What is interesting and sets apart the running back position from what we saw from the quarterback spot is that the diminishing trend shown above does not trickle down to the rest of the position. By taking a look at the 24th ranked running back (the last starter for a 12-team league) below, there is significantly less variation in performance and the average has remained relatively the same. This is telling us that the workhorse running backs at the top are losing value as their disparity in scoring has decreased relative to lower level starters.
Stay tuned for Part two which will delve into some of the rules we will create based upon benchmarks at the running back position.
[/am4show]
- Bowl Game Previews: CFB Playoff Semifinals - December 28, 2018
- The Narrative Fallacy and How it Compels Us - May 13, 2017
- 2017 NFL Draft – College Wide Receiver AIR - April 27, 2017


