2013 Quarterback Efficiency Rankings: Part One

Last year I began my descent into the metrics rabbit hole with an exploratory look into quarterback efficiency. Without sounding terribly redundant, I believe these studies are important, as I place pure skill on a much higher pedestal than I do volume. This couldn’t be truer than it is with the league’s signal callers, as a brief glance at the 2013 data shows the passing attempts amongst the league’s elite quarterbacks are highly variable – as such, we need to level the playing field. By looking at each player’s data on a per-play level, I was able to sift through the excess and identify the likely risers and fallers.
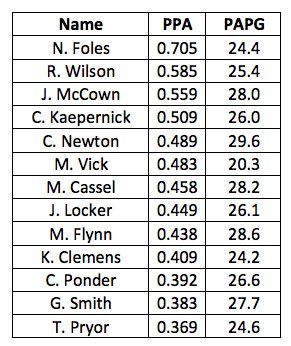
With a year gone by, it’s time to brush the dust off and reprise the work I’ve done with the points per passing attempt metric (PPA). As a quick reminder, to calculate a signal caller’s PPA I simply took the fantasy points solely from passing (0.4 points per passing yard and four points per touchdown) and divided them by the number of passing attempts. Points derived from running the ball are ignored in this study, but will provide fodder for a future date – simply put though, I believe them to be unpredictable on both a game-to-game and yearly basis. To me, a quarterback’s true value comes from what he’s able to do in the pocket.
With that said, I’ve decided to tweak things just a little bit for the 2013 data. In addition to ranking the top-45 (up from 35 in 2012) signal callers in terms of descending PPA values, I’ve also introduced a volume-based approach. This line of reasoning stems from the belief that it’s tougher achieve a higher efficiency as passing volume increases, and therefore the quarterbacks will also be broken down into three groups: greater than 35 weekly passing attempts, 30 – 34.9 weekly passing attempts and less than 30 weekly passing attempts. In addition to the overall list, this provides better context and essentially allows me to compare apples to apples.
Onto the data!
As previously mentioned, the following table lists the PPA values from best to worst, along with providing a breakdown for how each quarterback’s points were scored.
[am4show have=’p2;p3;p4;p5;p6;’ guest_error=’sub_message’ user_error=’sub_message’ ]

A Volume-Based Sorting Method
This data will be shown in both a tabular and graphical manner, starting with the quarterbacks who averaged over 35 passing attempts per game (PAPG).

The average PPA value for the 17 quarterbacks listed above was calculated to be 0.454 with a standard deviation of 0.088. Similar to my recent True Points column, the data can also be viewed graphically – in each graph the baseline equates to the PPA average while each tick-mark on the Y-axis (PPA values) signifies a difference of a standard deviation.

Let’s continue with the next tier of signal callers (30 – 34.9 PAPG):

The average PPA for this grouping was found to be 0.438 with a standard deviation of 0.071. These values are shown pictorially below:

Finally, let’s conclude with the quarterbacks who attempted fewer than 30 weekly passes.

The average PPA value for this last group was tabulated to be 0.479 with a standard deviation of 0.094. Once more, you can see the visual analysis below:

With this data in hand, Part Two of these efficiency rankings will focus on divergent performers, and what it might mean for 2014. Stay tuned!
Follow me on Twitter @EDH_27
[/am4show]
- Dynasty Fantasy Football Mailbag: Is Kendre Miller Valued Unfairly? - April 17, 2024
- Forgotten Dynasty Veterans: Bottom Tier - April 9, 2024
- Dynasty Fantasy Football Mailbag: How Much Should You Factor in Off-Field Issues? - April 9, 2024


