True Points Redux: A 2013 Assessment
Last August I created and detailed the True Points metric. The full reasons behind why I did so can be accessed via the link, but the Cliff’s Notes are basically that I wanted to remove as much scoring bias as possible at the running back position. To do so I subtracted fantasy points gained from touchdowns (somewhat unpredictable) and the point-per-reception (no equivalence on a play-to-play basis), providing a subset of scoring obtained solely from gaining yards (True Points). Simple division by the total number of touches then yielded the True Points per Touch (TPPT) metric.
In my opinion, this provides a clearer appraisal as to how well a running back functions with the ball in his hand. When I evaluate ball carriers this is the first thing I look for, as pure skill should transcend all other traits. Even if touchdowns, and to a lesser extent receptions are hard to come by, a running back with a higher TPPT metric should, at the very least, afford a higher weekly floor.
While no methodology is perfect, I believe the collection of 2012 data did a great job identifying both ascending and declining ball carriers. In this space last year players such as Jamaal Charles, Joique Bell, Pierre Thomas, Danny Woodhead and Darren Sproles were recommended as potential breakout candidates. Conversely, the TPPT metric warned against Arian Foster, Trent Richardson, BenJarvus Green-Ellis, Mark Ingram and Darren McFadden. There were certainly misses (CJ Spiller), but adhering to the “process over results” methodology yielded primarily positive results.
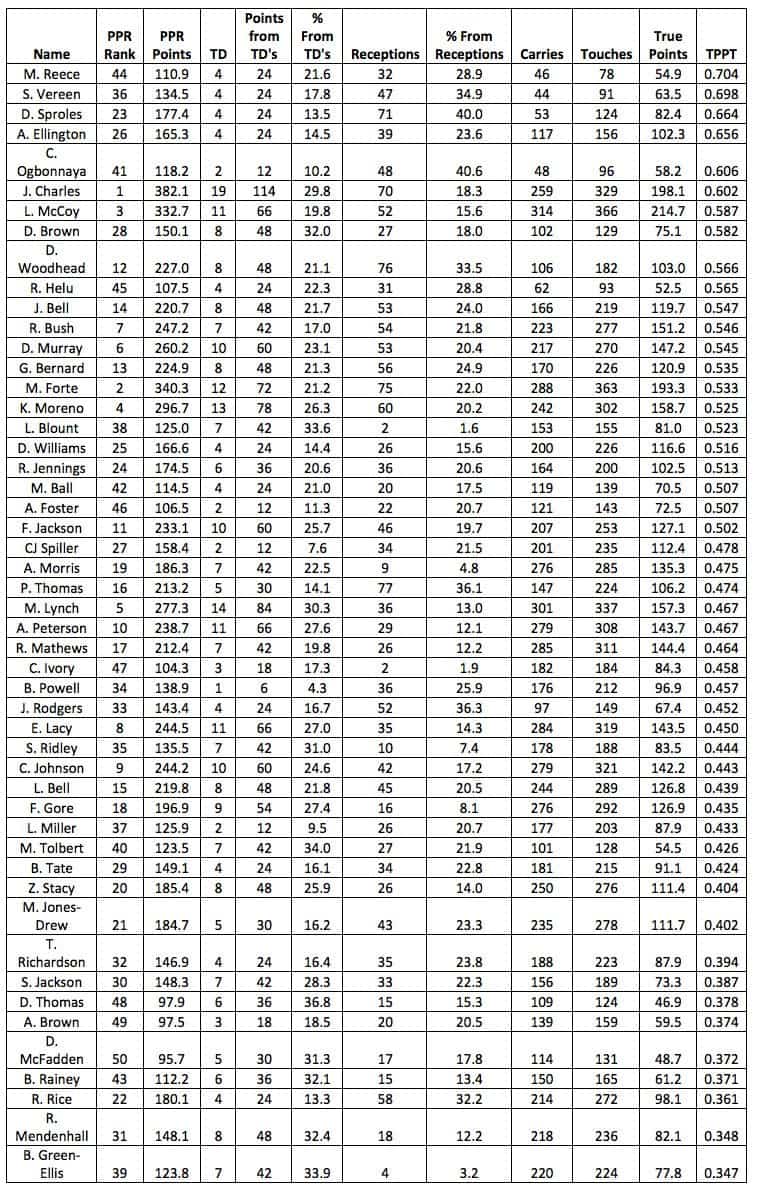
It’s with that in mind that I calculated the TPPT data for the top-50 PPR running backs of 2013. The TPPT values are listed in a descending manner and we’ll discuss some of the takeaways in part two of this series. Also included are each running back’s PPR rank, as well as the percentages of fantasy points each player gained from touchdowns and receptions.
[am4show have=’p2;p3;p4;p5;p6;’ guest_error=’sub_message’ user_error=’sub_message’ ]
A Volume-Based Approach
Another distinction I made with last year’s data set was to separate players by volume. A general trend with running backs is that efficiency typically decreases with increasing volume, so in that sense it makes sense to compare apples to apples. This year’s numbers were similarly segregated, with one subtle change – instead of using raw volume, the data was split up based on per-game volume averages. This yielded four distinct groups – players with 20-plus touches per week, 15 – 19.9 touches, 10 – 14.9 touches and less than 10 weekly touches.
Let’s begin with the data for the “hardest working” ball carriers:
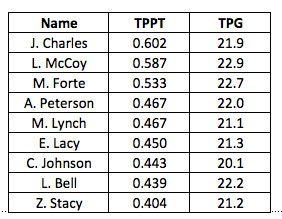
The nine players above effectively represent the league’s crop of bell-cows, and unsurprisingly all finished within the top-20 of the 2013 PPR rankings (45%), and eight were within the top-15 (53%). The average TPPT figure for this subset of players was calculated to be 0.488 with a standard deviation of 0.069. As a reminder, the standard deviation for each numerical grouping is important as it helps highlight which players performed at an aberrational level relative to the average, be it in a good or bad manner.
A pictorial view helps put these numbers into an even better perspective:
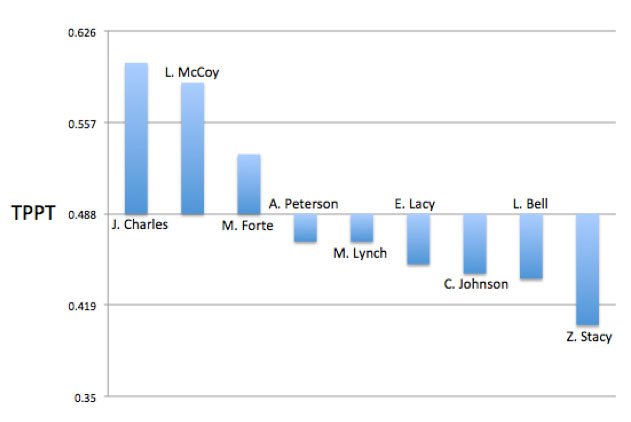
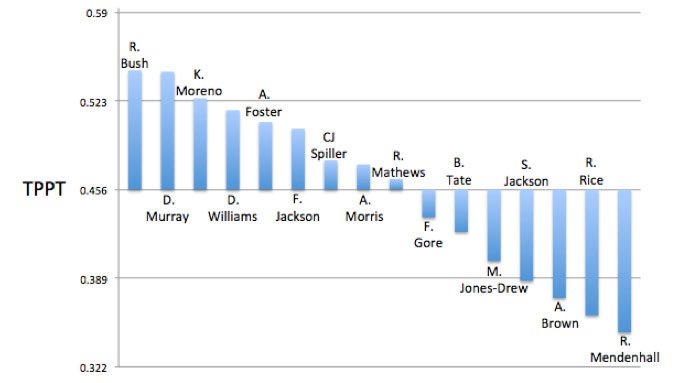
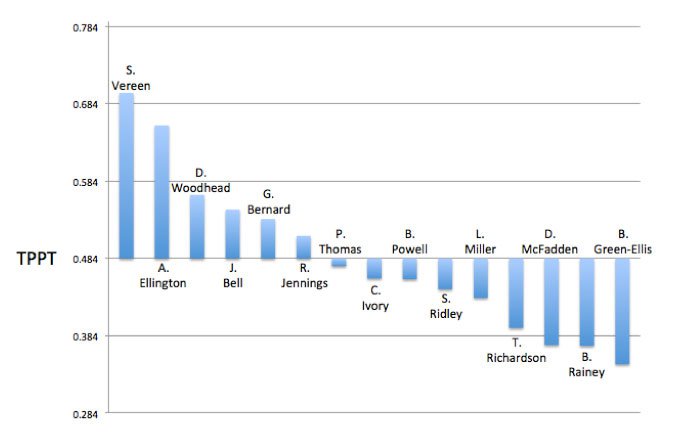
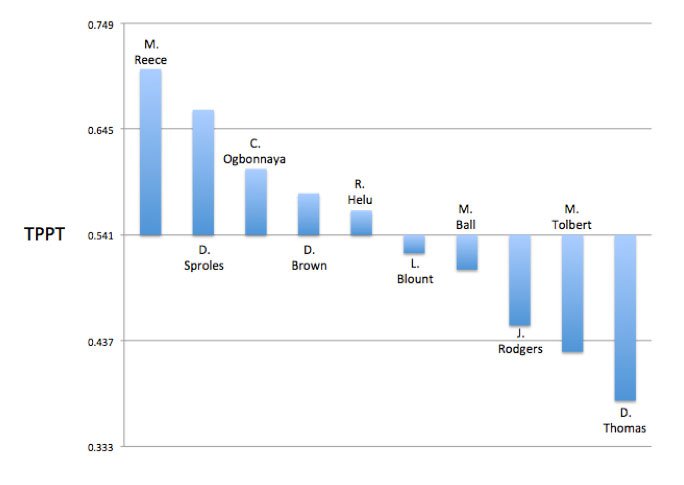
In the graph above, there are a few important things of note. Firstly, the average TPPT value of 0.488 was designated as the baseline, helping to elucidate how each player performed relative to the aggregate of his peers. Secondly, each tick mark on the y-axis shows a successive increase (or decrease) of a standard deviation, once again highlighting divergent performances. Each subsequent chart will convey the same message.
Next, let’s consider the numbers for running backs who received a weekly average of 15 – 19.9 weekly touches:
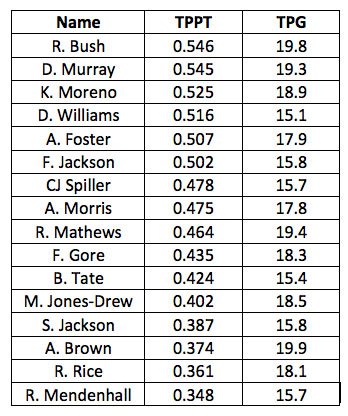
The TPPT average for the 16 players above was found to be 0.456, with a standard deviation of 0.067. Below is the graphical analysis:
Continuing, let’s focus on the players who received between 10 and 14.9 weekly touches:
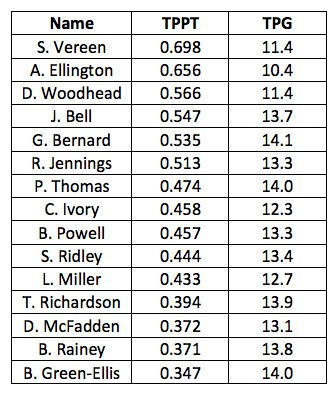
The average TPPT value for this grouping of 15 running backs was calculated as 0.484, with a standard deviation of 0.102. Shown visually, the data is clustered as follows:
Finally, we’ll conclude with the “lightweights,” or players who received fewer than ten weekly touches:
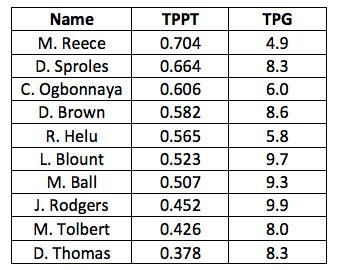
The TPPT average of the ten scantly used ball carriers above was calculated to be 0.541, with a standard deviation of 0.104. The graphical analysis is shown below:
So, that’s a look at the assessment. We’ll discuss some of the takeaways from the data in just a couple of days, giving you some time to soak all this in.
Follow me on Twitter @EDH_27
[/am4show]
- Dynasty Fantasy Football Mailbag: Justin Jefferson Or A Bundle Of Draft Picks? - April 23, 2024
- Dynasty Fantasy Football Mailbag: Is Kendre Miller Valued Unfairly? - April 17, 2024
- Forgotten Dynasty Veterans: Bottom Tier - April 9, 2024


