Wide Receiver Combine Analysis: Part One
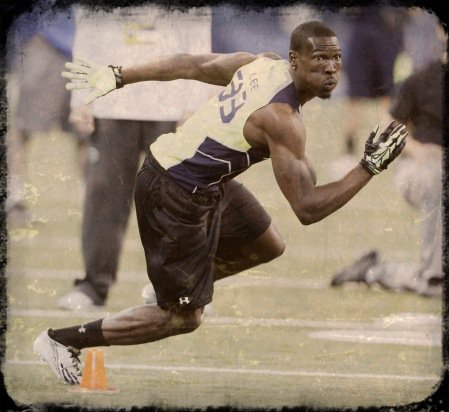 Late every February, several weeks after the Super Bowl is complete and just as our withdrawals for the NFL are almost at the point where our significant others think we might be cured of our addiction, the NFL combine rolls around. We flood to the TV and our computers to watch the new crop of rookies run, jump, catch and lift. We even get excited about seeing how they are built, which is really a strange thing when you think about it!
The major problem with the combine, other than our wives and others not understanding why we care about it since it “Isn’t real football,” is we often don’t know what we learned. Obviously we know that faster and stronger is better, but how much does it matter? If someone runs a 4.3 second time in the 40 yard dash but then turns around and only jumps 30 inches in the vertical jump and runs a 4.5 second time in the 20 yard shuttle does that matter? The short answer is yes, but the better question is how much does it matter?
For the last few years I’ve been trying to help answer those questions by sifting through the combine data and trying to lend a little statistical assistance to the wide receiver and running back groups. In the past few years this has taken on several different formats, but I decided to restructure everything for this year. The goal was to help fix some of the issues I wasn’t very happy with for the past few years in hopes of getting even more accurate reflections of the players to watch, and I feel much better about the results.
Here’s what I did:
Statistical Method
Since the goal of the combine for both NFL teams and fantasy owners alike is to try and figure out which of the incoming rookie class have what it takes to be at least a starter on an NFL team, it is important to compare them to that group. For that reason, I took the group of wide receivers who have been at least WR2s at some point over the last few seasons and used them as a baseline. I went back and pulled up all of their combine data and calculated the mean and standard deviation for each of the various drills.
Here’s where it gets a little bit more technical. I then took the official combine times for the various drills for the 2014 rookie class and calculated the z-score for each of those drills using the mean and standard deviation from the baseline group. The z-score, for those not familiar with it, is calculated by taking the value (in this case the time or measurement of the 2014 rookie) and subtracting the mean of the baseline group from it. That number is then divided by the deviation of the baseline group. The z-score represents the number of standard deviations a value is away from the mean. In a data set which is normally distributed, which all of the combine drills are, 68% of all data should be between z-scores of -1 and 1, 95% of all data should be between z-scores of -2 and 2, and only 2.5% of all data greater than a z-score of 2 while an additional 2.5% of data is less than a z-score of -2.
What does all of these mean to those who doesn’t really care much about statistics? It simply means the majority of all data, 68% to be exact, will be somewhere between a z-score of -1 and 1 for all of the drills. Scores between 1 and 2 or between -1 and -2 will be rarer but are not uncommon. Anything outside of that range is going to be quite rare though and either means they are severely deficient if they are on the negative end or elite if they are on the positive end.
Once the z-score was calculated for each of the drills, all of the z-scores for each individual were added together to get a composite score. Since a score of zero is the norm and the baseline group was fantasy WR2s or better, any rookie with a positive score is actually more physically gifted than the average of the baseline group. Anyone with a negative score is less physically gifted than the average of the baseline group.
Baseline Data
As mentioned previously, I used a group of veteran wide receivers, 36 in total, who have been WR2s or better in fantasy leagues over the last few years. This list of veterans included the obvious elite receivers such as Calvin Johnson, Julio Jones, AJ Green and Dez Bryant as well as less athletic but equally productive players such as Antonio Brown, Wes Welker and Eric Decker. I have even included new comers who produced at that level such as Alshon Jeffery.
I looked at a total of nine different values for each of the veterans and each of the rookies, assuming they participated in the drill or measurement. Here are the nine I considered, why I considered them, and the mean score for the baseline group:
Height – Bigger receivers are bigger targets. If someone is 6’5”, they don’t need to run as fast or be as agile as someone who is 5’9”. Mean: 73.25 inches (6’1.25”)
BMI (body mass index) – Instead of just using weight, which would largely be proportional to height, BMI is a more accurate measurement of how well built someone is, which is more important than just weight. Mean: 27.427
Hand Size – Receivers with larger hands have shown a tendency to make more sure handed catches and to have fewer drops. Mean: 9.5 inches
Arm Length – Longer arms means a larger catch radius. Mean: 32.5 inches
40 Yard Dash – The headline act of the combine, the 40 yard dash is all about straight line speed or long speed as it is sometimes called. Mean: 4.472 seconds
Vertical Jump – Measures lower body explosiveness and the ability of the receiver to go up and get a jump ball. Mean: 36.75 inches
Broad Jump – Another measure of explosiveness but this one is more about the ability of the receiver to push off and explode from the line of scrimmage or out of breaks in a route. Mean: 123.929 inches
20 Yard Shuttle – Measures the ability of the receiver to accelerate and decelerate. Mean: 4.246 seconds
Three Cone Drill – This tracks the ability of the receiver to keep their speed up while changing direction which is extremely important in route running. Mean 6.957 seconds
Disclaimers
No statistical study would be complete without a few disclaimers!
1) This score does not represent a complete picture of a prospect, merely a snap shot. This score merely reflects how well their physical size, runs and jumps compare to the baseline group. There is no attempt to neither quantify nor include extremely important items such as route running, work ethic, mental focus, or anything else of that nature.
2) A high score is not a prediction of success in the NFL. It merely means that player has physical tools that compare favorably to NFL receivers who have been at least fantasy WR2s. Likewise, a negative score does not predict failure in the NFL. It merely means that player’s physical tools are slightly below the average of the baseline group.
3) One of the best indicators of success for a NFL receiver is being selected in the first round of the NFL draft, especially in the first five or six picks. These receivers are successful at a much, much higher rate than those taken anywhere else. Outside of the first round, draft position doesn’t matter much. In fact, the success rate for second round receivers is very near the success rate of seventh round receivers. Give those taken in the first round a little boost.
4) Smaller receivers are at a slight disadvantage in this type of study; however, this is also an accurate reflection of the struggles they will face in the NFL. Life is more difficult if you are a receiver until six feet tall than if you are taller. You need to be faster, quicker, and more efficient because you don’t have that added cushion of size.
5) All data came from the combine and the official measurements. Sometimes players just have a bad day at the combine and drastically improve at their pro day, but it isn’t fair to just take the best score. In order to have a level playing field for all players only measurements from the combine were used.
The Results
It is time for the moment you’ve all been waiting for, the results for the 2014 draft class. There aren’t any super elite scores this year, meaning there isn’t anyone like Calvin Johnson (9.677 score), Julio Jones (8.899 score) or Andre Johnson (6.888). There are quite a few very good prospects with their scores in parenthesis.
Great (Scores between 2 and 6. Vincent Jackson, Alshon Jeffery, Demaryius Thomas and Larry Fitzgerald range):
Odell Beckham (5.512)
Jeff Janis (4.910)
Bruce Ellington (3.645)
Donte Moncrief (2.911)
Brandin Cooks (2.593)
Mike Evans (2.451)
Quincy Enunwa (2.342)
It was a bit of a surprise to me that Beckham was the top performer. As I mentioned earlier, smaller receivers tend to suffer in this type of metric. The fact that a 5’11” receiver scored this high, leading the draft class, says an awful lot about the talent. Beckham had elite times in the shuttle and three cone drill as well as being above average in everything else except height and slightly below the norm in his broad jump.
The other names that jump out to most people are going to be the other big named receivers such as Evans, Cooks and Moncrief. Evans gained very high marks for his size, especially his draft class leading wingspan with 35.125 inch arms. Combine that with speed drills within one deviation of the norm and you get a great prospect with size to spare. Cooks was on the other end of the spectrum, losing points for size but gaining major points for his speed drills, especially the best ever 3.81 second 20 yard shuttle. Moncrief had nice straight line speed and very good explosion in the jumps while having smaller hands and arms than average. I’ll have more on these guys in a follow up article.
Janis is a small school prospect who might be more athlete and less of a football player. He played division II and had very nice production there. Unfortunately, I think it was mostly because he was just a superior athlete and a big body at 6’3” and almost 220 pounds. He isn’t a great route runner and struggled to catch the ball at times (only 9 inch hands could be to blame). He also tended to shy away from contact and struggled to make catches when there were bodies around him. Reports are that he’s a high character player though, which means some of those issues might be able to be coached out of him. I think his chances of being a fantasy starter are slim, but you could do a lot worse with a late round flier.
Ellington was nearly identical to Beckham in almost all of the drills. The only difference is that Ellington is about two inches shorter and has smaller hands and arms. Ellington definitely has the physical tools to be in the NFL. The problem I have with Ellington is I think he’s pretty raw. He doesn’t run very nice routes and gets beat at the point of the catch quite a bit. He has a large frame for his height but he still gets pushed around quite a bit by defenders. He’s another player to watch later in your draft.
Enunwa only ran the 40 yard dash at the combine, so his score is a bit incomplete at this point in time. He has nice size and ran a very respectable 4.45 second time in the 40 yard dash. It would have been very interesting to see him run the shuttle and cone drills because one of the major concerns about him is his ability to change directions. This bleeds into his sometimes ineffective route running skills. He does a great job of winning at the point of the catch and out muscling defenders though. It will be interesting to see what NFL coaching will do to him. I’m not sure if his struggles running routes are due to lack of coaching or just being very tight. We’ll definitely find out!
Good (Scores between 0 and 2. Dez Bryant, Dwayne Bowe, Victor Cruz, Mike Wallace and Keenan Allen range)
Allen Robinson (1.917)
Jordan Matthews (1.707)
Mike Campanaro (1.180)
Damian Copeland (0.936)
Cody Latimer (0.866)
The big names in this group are of course Robinson and Matthews, both of whom were neck and neck with each other on most draft boards a few months ago. Since that time, Matthews has slowly pulled ahead in the eyes of most. In terms of combine numbers, Matthews has the edge in terms of size in every way except for build. Matthews was also faster in the 40 yard dash and kept his speed better while changing directions. Robinson was more explosive though and had better acceleration. All in all, they are still pretty close, but I give a slight edge to Matthews personally.
Campanaro is an undersized receiver out of Wake Forest. He showed very good burst and change of direction ability in the drills as well as respectable explosiveness in the jumps and a nice time in the 40 yard dash. The problems for Campanaro come down to his 5’9” height and his 30” arms, the lowest of the entire combine. It shows up in his game as well. From what I saw, he really struggled against press coverage and had a very limited catch radius. On the bright side, he does run very nice routes when he can get off the line unencumbered and knows how to play the position.
Copeland is another undersized receiver with a slim build, small hands and short arms. His speed is good, but not great. How did he end up with this kind of score then? Copeland showed elite acceleration and change of direction skills in the combine. His shuttle run was exceptional and his three cone drill was one of the best in the last ten years. Unfortunately, he isn’t as good in pads as he is in shorts. He struggles to run routes, can’t make a catch in traffic, and has a history of injuries. He could be a return man, but I think that’s about it for him.
Latimer didn’t participate in any drills at the combine and makes the list simply because he has better than average size. We aren’t really sure how good he would test out, but from what I saw he has nice leaping ability and nice hands, but he is far from a natural route runner and seems to have average speed at best. I don’t see much upside here even with his size.
That’s it for today!
I’ll be back with a look at the rest of the wide receiver draft class tomorrow. If you don’t see your favorite receiver here, that means they are probably on the negative side of the coin. Keep in mind that doesn’t mean they are doomed. Lots of extremely productive receivers such as Brandon Marshall, Reggie Wayne, Eric Decker and Percy Harvin also had negative scores. After all, this is a zero sum system so roughly half of the top receivers need to be negative as well. There does seem to be a bottom end to the scale, but more on that tomorrow.
- Final 2021 Pre-Draft Rookie Mock: Round Three - April 28, 2021
- Final 2021 Pre-Draft Rookie Mock: Round Two - April 26, 2021
- Final 2021 Pre-Draft Rookie Mock: Round One - April 25, 2021


