Rankings, The Great Myth: Running Back Edition
In our second installment of Rankings: The Great Myth, we will analyze the data on running backs. We use the same methods as with our first series on quarterbacks, and here is a review:
- Preseason projections were recorded for the 2013 season.
- Total points scored were recorded weeks 1 to 17 for all players included in this study.
- Standard scoring was used, as it was the method used in the projections data obtained from the site.
- Data for the top 40 running backs was recorded.
- Projected point totals were subtracted from actual point totals, and this ended up being a positive or negative number, depending on whether projections were over or underestimated.
- The accuracy of each author in predicting the exact numerical ranking for each player was recorded.
Table 1
|
2013 Top 10 Projected Point Differentials at Running Back |
||||
|
Author #1 |
Author #2 |
Author #3 |
Author #4 |
|
| Doug Martin |
+186 |
+197 |
+189 |
+181 |
| David Wilson |
+186 |
+205 |
+188 |
+150 |
| Arian Foster |
+135 |
+144 |
+145 |
+141 |
| Trent Richardson |
+123 |
+114 |
+128 |
+107 |
| Ray Rice |
+112 |
+112 |
+95 |
+103 |
| CJ Spiller |
+109 |
+106 |
+117 |
+94 |
| Daryl Richardson |
+103 |
+100 |
+125 |
+85 |
| Ahmad Bradshaw |
+99 |
+100 |
+109 |
+68 |
| Steven Jackson |
+76 |
+97 |
+77 |
+76 |
| Darren McFadden |
+80 |
+82 |
+67 |
+95 |
*2013 Projected Point Differential (PPD) = Projected points – Actual points
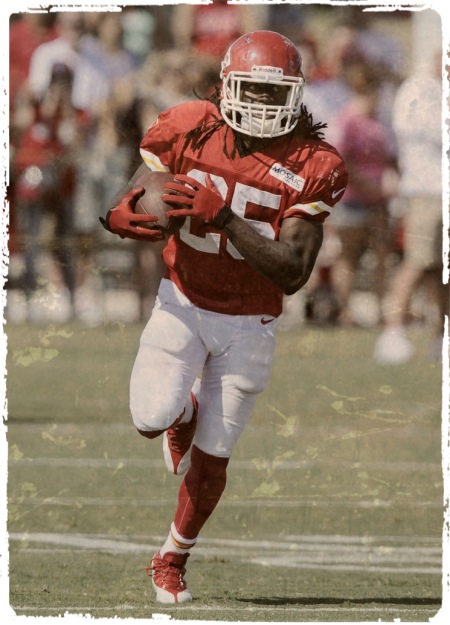
 Table 1 shows the top ten projected point differential (PPD) for running backs in 2013 and all were overestimates. The most prominent underestimate was -83 and that was one author who predicted Jamaal Charles would get 229 points, while he ended up with 312 points. It’s hard to criticize that pick, but it shows the difficulty in predicting players who will have monster seasons. All signs were there for Charles to be the RB1 in fantasy football, with Andy Reid hired as the head coach and his affinity for featuring his running backs, especially as receivers. Yet, Charles was projected as the 3rd to 7th running back in 2013. That’s not bad, but it again highlights the perils of projections, especially if fantasy players picked CJ Spiller or Trent Richardson over Charles.
It is interesting that all of the largest point differentials were overestimates. What is it about running backs that results in such a profound yet inefficient ranking of this position? Injuries do play a role, but that doesn’t tell the entire story. Doug Martin owners got shafted the most. Martin played the second most snaps in his 2012 rookie season (841 snaps), second only to Arian Foster (847 snaps). There was no reason to suspect Martin would get hurt, so injuries creeped in to wreck his projection, and Martin owners were left seething.
David Wilson was a sleeper at the position and not without merit. During Wilson’s last four games in 2012, he averaged 61 yards rushing, 5.5 yards per carry and had three touchdowns. Ahmad Bradshaw was out of the picture as well. Unfortunately, Wilson literally dropped the ball and ended up in head coach Tom Coughlin’s dog house. Once Wilson got back on the field, he scored his first touchdown in 2013 week five against the Philadelphia Eagles, Twitter exploded, his owners shed tears of joy, then Wilson hurt his neck and was gone for the year. It’s hard to criticize projecting Wilson as a top 12 RB or high-end RB2 in 2013, but the lesson learned is that unproven young talent won’t always succeed. Owners of Eddie Lacy, Gio Bernard and LeVeon Bell might disagree, but take a close look at unproven young players before betting the house on them. Wilson ended the year as RB92, behind such stalwarts as Fozzy Whittaker, Daryl Young and Frank Summers. Matt Asiata outscored David Wilson’s 2013 output in one game.
It seems sacrilegious to suggest Arian Foster was a bad pick. In training camp, he suffered a back injury that required an epidural steroid injection and he ended up on IR. He ultimately required back surgery, which is never good for a soon-to-be 28 year old running back coming off a 2012 season with almost 400 total touches. The good news is he has fewer career touches (1,320) than players like LeSean McCoy (1,421), Matt Forte (1,892) or Marshawn Lynch (1,955), all similar in age or younger. Still, with head coach Gary Kubiak moving on, Foster owners have to be a little nervous about his future. Foster came into 2013 with declining yards per carry average and reception totals since 2010. Foster was picked to finish as a top 10 running back, but what would fantasy owners have said if the same authors picked him to finish as the RB44 or Ray Rice the RB30? They would have screamed in outrage, used foul language and cast out the authors as lunatics, yet those authors would have been right. Are those who publish projections reticent to drop players like Foster or Rice for fear of being singled out or shamed in public? Are we afraid of making that bold choice? Or, do we simply not have enough tools to support our intuition, and does that make us hesitant to make bold calls? It may sound unfair, but I think it is a legitimate question.
CJ Spiller was a great mystery in 2013. Coming off a huge 2012 breakout season, he failed to reach fantasy owners elite expectations in 2013. Spiller was hindered by a high-ankle sprain since week 4, but even before this injury, Spiller averaged 1.65 YPC in weeks 1 and 3. Could a coaching change from Chan Gailey to Doug Marrone have influenced Spiller’s production? Or, is he just overrated? Ryan Mathews got excoriated by fantasy players after following up a solid 2011 fantasy season with 100 fantasy points in 2012. In fact, Mathews had more PPG in his poor 2012 season (8.3) than Spiller did in 2013 (7.1 PPG). Yet, it seems like Spiller gets a free pass. Mathews ended up with a huge season in 2013 (1,255 yards, 6 TD, 26 receptions, 189 yards, 1 TD), so perhaps Spiller owners are justified in predicting a bounce-back year in 2014. Spiller will turn 27 in 2014, and he is running out of chances to show he belongs in the elite tier of dynasty RBs. It will be interesting to see how Spiller gets ranked for 2014, both in re-draft and dynasty formats. Will there be a bold position taken either way?
For all the fanfare Trent Richardson got in 2012, he just didn’t look that good. Yeah, he had 3.6 YPC. That got a lot of press. But, Richardson looked slow, indecisive and not a special talent. Had he not caught 51 balls, his rookie season would have been a complete disaster. Despite all the signs of an imminent catastrophe in 2013, Richardson was projected to finish as a top ten running back, but he ended the season as the RB34.
Darren McFadden had all the signs of underachieving, and yet he was picked to finish with 150 to 178 fantasy points. McFadden ended 2013 with 83 points, good for RB45. Where was the logic in predicting McFadden would finish as a mid-to-low end RB2? Other than a solid 2010 season, he finished with a meager 64 to 113 points in 2008 to 2012. Oakland was supposed to revamp its rushing strategy to help McFadden have a breakout year, and yet he spent his usual time injured on the bench (six games).
Steven Jackson is a 30 year old back who finished at 3.5 yards per carry and replaced a 30 year old RB, Michael Turner, who had 3.6 YPC in 2012. Turner got dumped by Atlanta after a 2012 season with 803 yards and ten touchdowns. Jackson didn’t come close to Turner’s production in 2013 (542 yards, seven touchdowns). Jackson’s yardage has declined since 2010, and he has 2,992 career touches. 30 year old backs with almost 3,000 touches don’t last long in the NFL. It seems that Jackson’s move to the Atlanta Falcons pushed up his stock to unrealistic heights and this may have influenced his projections.
Daryl Richardson was a seventh round pick and put up 475 yards and zero touchdowns in 2012, good for 62 fantasy points. How does that translate into 118 to 158 projected points for 2013? Authors overshot Richardson by an average of 103+ points. I think quite a few running backs had overly optimistic projections mainly from situation, but ignoring all the baggage that came along with them.
Honorable mention goes to Mark Ingram and Ronnie Hillman. Projections for Ingram in 2013 ranged from 91 to 144 points. His first two years in the NFL, Ingram averaged 87 points per year, and his situation in New Orleans didn’t change much. Pierre Thomas and Darren Sproles were still in his way. Sean Payton was back, but the last time he coached the Saints in 2011, Ingram had 82 points. One author did project Ingram for 91 points, but even he ended up overshooting the projection by 40 points. The other three authors projected Ingram 126 to 144 points, an overshot by an average of 82 points.
Hillman is another curious case. He was projected to score 114 points by two authors, 75 points above his final point total of 39 points. Knowshon Moreno’s average projection was 71 points, and he ended up RB5 with 236 points. Head coach John Fox has a habit of not trusting young players. If you look at Moreno’s numbers, throw out his 2011 season when he tore his ACL, and he has averaged 142 points per season. It seems our disdain of Moreno clouded the obvious. No way would Fox ever trust young players like Montee Ball and Hillman as his running back and blocker for Peyton Manning. Despite the obvious, Moreno was a distant third in projections, behind even Ball for all four authors.
Table 2
|
2013 Projections Finishing Top 10 and Top 20 (%) |
||||
|
Author #1 |
Author #2 |
Author #3 |
Author #4 |
|
|
Top 10 RB |
30% |
30% |
30% |
30% |
|
Top 20 RB |
50% |
50% |
50% |
45% |
Table 2 presents the data on the percentage of correct calls for top 10 and top 20 RBs. The authors correctly chose 50-60% of the top 10 QBs, but with RBs, success rates are much less at 30%. If you compare 2013 to the past three years, only 30-40% of RBs were still top 10 RBs in 2010 to 2012. Turnover at RB is simply too high to have reliable projections. Unlike QBs, where authors still had 70-75% success rates in predicting the top 20 QBs, success rates dropped to 45-50% in predicting top 20 RBs, showing how much harder it is to accurately project the RB position with many more players to evaluate.
Table 3
|
2013 Projected Rank Number Correct |
||||
|
Author #1 |
Author #2 |
Author #3 |
Author #4 |
|
|
RB (n=40) |
0 |
0 |
0 |
2.5% (n=1) |
I reviewed rankings for the top 40 RBs across four authors, and that gave 160 opportunities to get the correct rank number. There was only one player ranked correctly, and that was Bilal Powell as RB36 for one author. That is 1 out of 160 rankings turning out correct, or a 0.625% success rate. No author predicted the correct rank number for the top 35 RBs.
Table 4
|
2013 Average Projected Points Differential and Range (Over and Under) |
||||
|
Author #1 |
Author #2 |
Author #3 |
Author #4 |
|
|
RB (n=40) |
+69 (3 to 186) -36 (-1 to -83) |
+77 (5 to 205) -31 (0 to -73) |
+76 (5 to 189) -33 (-3 to -49) |
+75 (7 to 181) -35 (-1 to -81) |
Table 4 shows the PPD for running backs in 2013, both as an average and range. There is a strong tendency for authors to overestimate potential points at the running back position, with projections averaging 69 to 77 points above final point totals. It is interesting to note the extent of underestimates is much less pronounced, with worst case scenarios 49 to 83 points below actual point totals. For overestimates, it’s 181 to 205 points above projections. This is a problem for fantasy owners, as if running back projections are going to be wrong, players are more likely to far underperform projections. We are more likely to tolerate underestimates, as that will result in a player far exceeding expectations, and thus will appear to be sleepers or breakouts. This data suggests that top 40 running backs are more likely to bust big time rather than break out for us
Table 5
|
Total Number of Over or Underestimated Player Projections |
||||
|
Author #1 |
Author #2 |
Author #3 |
Author #4 |
|
|
Over (n=40) |
26 |
26 |
27 |
23 |
|
Under (n=40) |
14 |
14 |
13 |
17 |
Table 5 shows a strong tendency for authors to overestimate projected points, similar to quarterbacks. All authors tended to miss at nearly the same level. This suggests that authors might be hesitant to drift too far from each other’s projections, similar to quarterbacks. It might be easier to fail as a group then miss on a bold projection that strays from the herd. It’s not a criticism, but a reflection of human behavior, and our desire to avoid being criticized by the crowd.
So how can we use this data to improve projections and rankings of RBs?
- Injuries will adversely impact running backs, and it is inevitable. Some injuries will be hard to predict, like Martin, but others may show signs of decline, and boldly moving away from such players could pay dividends.
- Age should not be ignored at RB. Jackson inherited what seemed like a golden opportunity in Atlanta, but his projections were not realistic for a 30 year old RB with 2800+ touches through 2012.
- Do not ignore trends, no matter how attractive the situation. Fantasy owners were burned by busts like Bradshaw, McFadden, Jackson, Wilson, Trent and Daryl Richardson, and signs were there to stay away.
- As with quarterbacks, don’t stick with the herd. Be bold with predictions and it could pay off handsomely. The worst case scenario isn’t so bad, given data presented in this article.
- Dynasty Capsule: Carolina Panthers - February 3, 2017
- The Dynasty Doctor: CJ Anderson - January 25, 2017
- The Dynasty Doctor: Week 15 - December 20, 2016


