Then and Now: Wide Receivers
“As the present now will later be past, the order is rapidly fadin’. And the first one now will later be last, for the times they are a changin’.”
– Bob Dylan
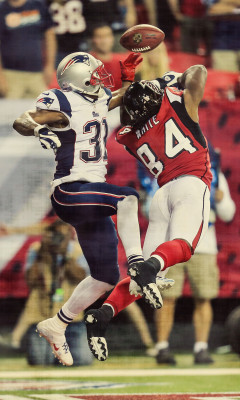 What a difference a year can make. Only seven short weeks into the season, the NFL has already been awash in a sea of change including such events as the Kansas City Chiefs starting off the year as the only unbeaten team, the previously moribund Cleveland Browns outperforming division rival Pittsburgh, and prior NFC heavyweight Atlanta already losing more games than they did all of 2012. Not shockingly, this restructuring has impacted multiple players in the fantasy landscape as well.
Put another way, we set our pre-season expectations largely based off of a year’s worth of evidence from last season. We observed these trends in order to help clarify the outlooks of many players of interest, but now have a reasonable amount of current data in hand. So – what’s changed?
This short series sets out to answer that very question. This four-part breakdown will look at the top ten players at each position from 2012, and compare how they’re performing so far in 2013. From there we can decide if it’s time to reset our expectations in order to predict the potential results for the remainder of the season.
In order to do so, it’s time to bust out some statistics, and by now it’s no secret to the DLF masses that I’m a huge proponent of efficiency metrics. Instead of explaining this affinity yet again, I’ll just refer you here, here, here, here and here. Simply put, in my opinion it’s the best way to not only compare apples to apples, but to essentially pluck them from the identical branch of the same metaphorical tree.
In that spirit, key efficiency metrics will be used in order to judge each player’s progression (or regression) in the past year. I’ll also include rationale as to why things could be going the way they are, as well as insight towards the future. Let’s continue with the wide receivers!
Before we dive into the data, here’s a list of abbreviations and explanations for the key terms used:
Fantasy Points Per Game (PPG) – Each player’s weekly output according to standard WCOFF PPR scoring.
Targets Per Game (TPG) – A weekly summation of each player’s opportunities.
Touchdowns Per Game (TDPG) – The number of receiving touchdowns divided by the total number of games played.
Points Per Target (PPT) – The number of PPR fantasy points divided by the total number of targets.
Yards Per Target (YPT) – The figurative “degree of difficulty” of making catches. YPT combines the yards-per-catch and catch percentage statistics, and can be calculated by dividing the total yards by the number of targets.
Percent Change to the Quarterback’s Points Per Passing Attempt (%CPPA) – I’ve previously defined a quarterback’s points per passing attempt (PPA) as “a quarterback’s total fantasy points from passing (rushing points subtracted) divided by his total passing attempts.” %CPPA is the percent difference between a quarterback’s PPA when he only targets the receiver in question versus his overall PPA. It provides insight into whether or not the receiver elevates the quarterback’s play, regardless of how bad the quarterback in question is playing.
Percent Changes (% Change) – This shows the differences for each metric between 2012 and 2013.
Let’s get started! (Editor’s note: All 2013 statistics include only the first six weeks of the season)
Calvin Johnson, WR DET
|
Year |
Rank |
PPG |
TPG |
TDPG |
PPT |
YPT |
%CPPA |
|
2012 |
1 |
21.8 |
12.8 |
0.31 |
1.71 |
9.63 |
28.1 |
|
2013 |
23* |
16.3 |
9.6 |
0.80 |
1.70 |
7.02 |
19.6 |
|
% Change |
– |
-25.2 |
-25.0 |
158.1 |
-0.6 |
-27.1 |
-30.2 |
*denotes a missed game due to injury
Then and Now: Thus far in 2013, Megatron has been somewhat of a mega disappointment. Apart from a significant rise in his rate of touchdown scoring, Johnson’s numbers have fallen across the board. This is due in large part to his attempts to play through a knee injury, which have thus far proven unsuccessful. He’s still making quarterback Matt Stafford look better, but this is due more to the scores than anything else.
Future Prognosis: It’s a testament to Johnson’s greatness that checking in as the WR15 in terms of PPR points per game is considered a “poor” effort. Seemingly getting healthier as the days go by, it’s a good bet that Megatron will return to his previously unrivaled statistical ways.
Brandon Marshall, WR CHI
|
Year |
Rank |
PPG |
TPG |
TDPG |
PPT |
YPT |
%CPPA |
|
2012 |
2 |
20.9 |
12.0 |
0.69 |
1.74 |
7.85 |
18.5 |
|
2013 |
3 |
19.4 |
9.7 |
0.83 |
2.01 |
8.02 |
25.6 |
|
% Change |
– |
-7.2 |
-19.2 |
20.3 |
15.5 |
2.2 |
38.4 |
Then and Now: Marshall’s slight “regression” pretty clearly boils down to a case of quantity versus quality. Though he’s received only 80% of the targets per game that he did in 2012, he’s doing significantly more with them – this is exemplified by significant increases to his PPT and %CPPA statistics. He’s also scoring at a higher rate than he did in 2012, and remains a great threat in the red zone.
Future Prognosis: In new head coach Marc Trestman’s scheme, Marshall isn’t going to be the target hog he once was. Pass catchers Alshon Jeffery and Martellus Bennett have carved out roles in the offense, and running back Matt Forte has also been more involved in the passing game. Regardless, with improved play by quarterback Jay Cutler, Marshall will likely continue to be a top fantasy play. (Editor’s note: This was written before Cutler’s injury on Sunday)
AJ Green, WR CIN
|
Year |
Rank |
PPG |
TPG |
TDPG |
PPT |
YPT |
%CPPA |
|
2012 |
3 |
18.9 |
10.3 |
0.69 |
1.82 |
8.23 |
23.4 |
|
2013 |
8 |
17.9 |
11.5 |
0.67 |
1.56 |
6.72 |
11.4 |
|
% Change |
– |
-5.3 |
11.7 |
-2.9 |
-14.3 |
-18.3 |
-51.3 |
Then and Now: Green has basically been the antithesis of Marshall above. An uptick in usage hasn’t been enough to offset a dramatic decrease in efficiency, highlighted by a drastically diminished YPT statistic. Though it’s fair to place some blame at the feet of quarterback Andy Dalton, Green just hasn’t been doing as much to elevate his play. With that said, the combination of volume (he has more than double the targets of any other Bengals’ pass catcher) and scoring has kept him as a legit WR1.
Future Prognosis: Until Dalton starts playing better, Green seems likely to put up a mixed bag on a weekly basis. In fact, in four of the six games thus far in 2013, he’s recorded 61 or fewer yards. He’ll still finish the year as a WR1, but needs upgraded play under center to truly reach the ranks of the elite.
Dez Bryant, WR DAL
|
Year |
Rank |
PPG |
TPG |
TDPG |
PPT |
YPT |
%CPPA |
|
2012 |
4 |
18.9 |
8.6 |
0.75 |
2.19 |
10.01 |
54.1 |
|
2013 |
4 |
19.3 |
9.0 |
1.0 |
2.15 |
8.50 |
34.7 |
|
% Change |
– |
2.1 |
4.7 |
33.3 |
-1.8 |
-15.1 |
-35.9 |
Then and Now: After a late-season surge that saw Bryant average 110 receiving yards and 1.25 touchdowns over his last eight games in 2012, expectations were high for 2013. Thus far, Bryant hasn’t disappointed. Though it was unreasonable for Bryant to sustain that pace over an entire season, he’s still scoring at a high rate, averaging over two points per target and making quarterback Tony Romo look 34.7% better than his season average. The negative percentages in the bottom row look disappointing, but are merely nothing more than a reflection of just how dominant Bryant was in 2012.
Future Prognosis: Fellow receiver Miles Austin is hurt yet again, and starting running back DeMarco Murray could miss up to four games. With quarterback Tony Romo playing exceptionally well, Bryant should continue to reap the benefits and threaten to be the top overall scorer at the receiver position.
Demaryius Thomas, WR DEN
|
Year |
Rank |
PPG |
TPG |
TDPG |
PPT |
YPT |
%CPPA |
|
2012 |
5 |
18.6 |
8.8 |
0.63 |
2.11 |
10.23 |
21.6 |
|
2013 |
5 |
19.0 |
8.2 |
0.67 |
2.32 |
10.78 |
6.5 |
|
% Change |
– |
2.2 |
-6.8 |
6.3 |
10.0 |
5.4 |
-69.9 |
Then and Now: Much like Bryant above, Thomas is putting on a fantastic encore performance to his excellent 2012 campaign. Significant increases in efficiency have neutralized a slight decrease in volume, and the young receiver is averaging an insane 10.78 yards per target. To put that figure into context, Patriots’ receiver Danny Amendola has a career average of 8.9 yards per catch. Don’t worry about the decreased %CPPA – quarterback Peyton Manning has been downright absurd this year.
Future Prognosis: Thomas remains the best big-play threat in one of the league’s most prolific offenses. If healthy he appears to be a lock for sustained production.
Andre Johnson, WR HOU
|
Year |
Rank |
PPG |
TPG |
TDPG |
PPT |
YPT |
%CPPA |
|
2012 |
6 |
18.5 |
10.1 |
0.25 |
1.83 |
9.86 |
12.1 |
|
2013 |
15 |
15.6 |
10.8 |
0.00 |
1.44 |
7.62 |
-15.7 |
|
% Change |
– |
-15.7 |
6.9 |
-100.0 |
-21.3 |
-22.7 |
-229.8 |
Then and Now: Maybe it’s the last name? Much like the similarly surnamed Calvin, Andre Johnson hasn’t been able to follow up his stellar 2012 season with numbers befitting his talent. This is due in large part to his lack of receiving touchdowns, which has diminished both his PPT and %CPPA metrics, but Johnson truthfully hasn’t been a big scorer these past few years anyway. Constant nagging injuries haven’t helped, nor has pathetic quarterback play from Matt Schaub, but Johnson appears to be regressing.
Future Prognosis: With Schaub hurt, the reigns have been temporarily handed over to the unproven Case Keenum. While Keenum could lock onto his best receiver, it’s now unreasonable to expect Andre to achieve his 2012 levels of fantasy stardom.
Wes Welker, WR DEN
|
Year |
Rank |
PPG |
TPG |
TDPG |
PPT |
YPT |
%CPPA |
|
2012 |
7 |
18.2 |
10.9 |
0.38 |
1.65 |
7.74 |
-11.5 |
|
2013 |
2 |
20.5 |
8.3 |
1.33 |
2.46 |
7.56 |
25.6 |
|
% Change |
– |
12.6 |
-23.9 |
250.0 |
49.1 |
-2.3 |
322.6 |
Then and Now: Tom who? At least for now it appears Welker has won the “bromance” breakup between he and former signal caller Tom Brady, and this is due in large part to a pronounced increase in touchdown scoring. During his time in Foxboro, Welker averaged one touchdown per every 25 targets, a number that has jumped to one per every 6.3 targets in Denver. The Broncos are calling his number in the red zone, and Welker has responded by averaging an eye-popping 1.33 scores per game. He’s not receiving the same volume he did as a Patriot, but simply put – he hasn’t needed to.
Future Prognosis: While I’m expecting Welker’s rate of scoring to dip, he’s still catching 74% of his passes and averaging 6.2 receptions per game, enabling him to remain lethal in a PPR setting. He’s locked and loaded as a high-end WR1 as long as Manning is under center.
Reggie Wayne, WR IND
|
Year |
Rank |
PPG |
TPG |
TDPG |
PPT |
YPT |
%CPPA |
|
2012 |
8 |
16.9 |
12.2 |
0.31 |
1.39 |
6.95 |
-9.3 |
|
2013 |
16 |
15.3 |
8.5 |
0.33 |
1.80 |
8.98 |
19.1 |
|
% Change |
– |
-9.5 |
-30.3 |
6.5 |
29.5 |
29.2 |
305.4 |
Then and Now: The Colts are averaging only 31.3 pass attempts this year, down significantly from the 39.2 they averaged only a year ago. This has caused Wayne to shift from being over-targeted to the detriment of his efficiency in 2012, to a player making the most of his opportunities so far in 2013. His numbers are up across the board, highlighted by a three-fold increase in his effect on quarterback Andrew Luck. The old man can still get it done.
Future Prognosis: The Colts’ balanced offense has led them to a record of 4-2 to open the season, so it’s stands to reason they’ll continue with what works. However, if Wayne were to get even a modest bump in volume while maintaining his per-play effectiveness, he should settle in as a low-end WR1 when all is said and done. (Editor’s note: This was written prior to Wayne’s injury on Sunday)
Eric Decker, WR DEN
|
Year |
Rank |
PPG |
TPG |
TDPG |
PPT |
YPT |
%CPPA |
|
2012 |
9 |
16.8 |
7.6 |
0.81 |
2.21 |
8.72 |
31.8 |
|
2013 |
14 |
15.6 |
8.3 |
0.33 |
1.87 |
9.54 |
-21.6 |
|
% Change |
– |
-7.1 |
9.2 |
-59.3 |
-15.4 |
9.4 |
-167.9 |
Then and Now: While Decker had a breakout 2012 season, it was believed by many that he would take a step back due to a likely unsustainable rate of scoring. Though this had turned out to be true, it’s due less to the rate of scoring, and more to who’s doing the scoring. As mentioned above, new addition Wes Welker has surprisingly taken over as the primary red zone threat, and Decker has been picking at the leftover touchdown scraps. His volume and YPT are up, but the dramatic decrease in scoring has led to the other metrics tailing off.
Future Prognosis: It’s disingenuous to call Decker the “third banana” in the Denver offense, as Manning simply hits the player who’s open. Given how proficient they’ve been, Decker should continue to function as a viable starter, even if it’s more WR2 than WR1.
Roddy White, WR ATL
|
Year |
Rank |
PPG |
TPG |
TDPG |
PPT |
YPT |
%CPPA |
|
2012 |
10 |
16.8 |
8.9 |
0.44 |
1.88 |
9.45 |
12.8 |
|
2013 |
89* |
5.4 |
4.4 |
0.00 |
1.22 |
5.86 |
-47.9 |
|
% Change |
– |
-67.9 |
-50.7 |
-100.0 |
-35.1 |
-38.0 |
-474.2 |
* denotes the player has already had his bye week
Then and Now: Perhaps fittingly, White is bringing up the rear of this column. After sustaining a high ankle sprain in a preseason game, White attempted to come back too soon and just hasn’t been the same player. Acting mostly as a decoy so that opponents were unable to double team fellow receiver Julio Jones, White has had inarguably the worst season of his distinguished career. He’s barely been targeted, hasn’t scored and the few receptions he’s corralled have been of the dink and dunk variety. Put succinctly, it’s been a nightmare for the venerable pass catcher.
Future Prognosis: When it rains, it pours. White suffered a hamstring injury in week five, and despite having a bye week to heal he’s already been ruled out of the Falcons’ week seven game against Tampa Bay. When he gets healthy he should benefit from the season-ending injury suffered by Julio Jones, but no one knows when that will be. At least it can’t get any worse.
Tomorrow we wrap up the mini-series with the WR position. You can follow me on Twitter @EDH_27
- Dynasty Fantasy Football Mailbag: Is Kendre Miller Valued Unfairly? - April 17, 2024
- Forgotten Dynasty Veterans: Bottom Tier - April 9, 2024
- Dynasty Fantasy Football Mailbag: How Much Should You Factor in Off-Field Issues? - April 9, 2024


